. 2014 Mar;141(5):1011-21.
doi: 10.1242/dev.102178.

Transcription factor expression uniquely identifies most postembryonic neuronal lineages in the Drosophila thoracic central nervous system

Affiliations

Transcription factor expression uniquely identifies most postembryonic neuronal lineages in the Drosophila thoracic central nervous system

Haluk Lacin et al. Development. 2014 Mar.

Abstract

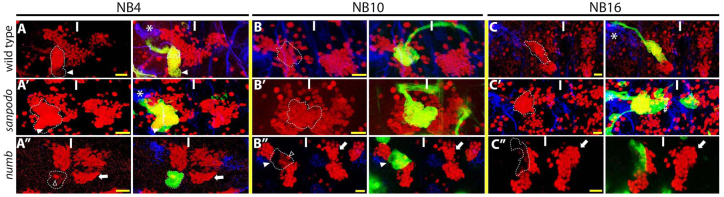
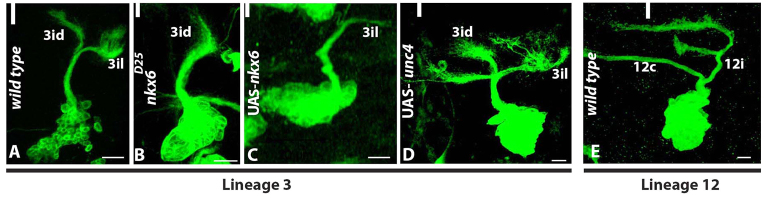
Most neurons of the adult Drosophila ventral nerve cord arise from a burst of neurogenesis during the third larval instar stage. Most of this growth occurs in thoracic neuromeres, which contain 25 individually identifiable postembryonic neuronal lineages. Initially, each lineage consists of two hemilineages--'A' (Notch(On)) and 'B' (Notch(Off))--that exhibit distinct axonal trajectories or fates. No reliable method presently exists to identify these lineages or hemilineages unambiguously other than labor-intensive lineage-tracing methods. By combining mosaic analysis with a repressible cell marker (MARCM) analysis with gene expression studies, we constructed a gene expression map that enables the rapid, unambiguous identification of 23 of the 25 postembryonic lineages based on the expression of 15 transcription factors. Pilot genetic studies reveal that these transcription factors regulate the specification and differentiation of postembryonic neurons: for example, Nkx6 is necessary and sufficient to direct axonal pathway selection in lineage 3. The gene expression map thus provides a descriptive foundation for the genetic and molecular dissection of adult-specific neurogenesis and identifies many transcription factors that are likely to regulate the development and differentiation of discrete subsets of postembryonic neurons.

Keywords: Adult neurogenesis; Drosophila; Gene expression map; Hb9.


Figures

Fig. 1.
Fig. 1.
Postembryonic expression of Hb9 marks three clusters of neurons in the wild-type thoracic CNS. (A) Hb9 expression in (left to right) the dissected CNS of a first instar, second instar, third instar and late third instar larva. Brackets identify thoracic segments. (B,C) Hb9 expression in two thoracic segments (T2, T3) of a late third instar larval CNS (B) and a single hemisegment (T2) of a mid-pupal CNS (48 hours after pupariation; C). (D,E) Hb9 (green) and EdU (red) labeling in the ventral (D) and dorsal (E) region of a thoracic neuromere of a late third instar larva. (F) Hb9 (blue) and EdU (red) labeling in a MARCM clone in an explant of a late third instar larval CNS treated with EdU for 12 hours immediately before fixation. The large arrowhead points to the NB, small arrowheads to GMCs; arrow points to the Hb9+ and EdU+ neuron. Anterior, up; white bar, midline. Scale bars: 100 μm in A; 10 μm in B-F.
Fig. 2.
Fig. 2.
Hb9 expression labels three postembryonic lineages. (A-C) High magnification views of a wild-type thoracic neuromere of late third instar larvae labeled for Hb9 (red), GFP (green) and FasII (blue) expression. Wild-type MARCM clones are shown in A-C; spdo mutant MARCM clones are shown in A′-C′; numb mutant MARCM clones are shown in A′-C′. In A-C, asterisks denote the leg neuropil. In A, A′ and B′, arrowheads point to Hb9- NB and GMCs. In C′, # denotes a second, unrelated GFP+ MARCM clone. In A′ and B′, open arrowheads point to Hb9+ neurons located in different focal planes than the numb mutant MARCM clones. In A′-C′, arrows point to the Hb9+ neurons of relevant lineages in the unaffected contralateral hemisegment. Dashed lines, lineage boundaries. Anterior, up; white bar, midline. Scale bars: 10 μm.
Fig. 3.
Fig. 3.
Overlapping expression of Hb9, Nkx6, Lim3, Islet and Apterous in thoracic CNS of late third instar larvae. (A-E) High magnification ventral views of single wild-type neuromeres labeled for the indicated proteins. Dashed lines identify predicted boundaries for each lineage; lineage designations are provided for the left hemisegment. The boundaries of some lineages appear to overlap, but are in different focal planes. In C, Lim3 expression in lineage 8 is not in the focal plane of the image. Scale bars: 10 μm. Anterior, up; white bar, midline.
Fig. 4.
Fig. 4.
Nkx6 and Dbx label the A and B hemilineages of lineage 3. (A-C) Lineage 3 wild-type (A), spdo mutant (B) and numb mutant (C) MARCM clones in the second thoracic segment of late third instar larvae labeled for the indicated proteins. (A) Lineage 3 neurons extend two ipsilateral axonal bundles: 3id and 3il. (B) spdo mutant MARCM clone labeled for Dbx. (C) numb mutant MARCM clones labeled for Nkx6. (D) Wild-type MARCM labeled for Nkx6 (red) and Dbx (blue). (E) Ventral portion of a wild-type lineage 3 clone in a late third instar larva labeled for En (red): the NB (encircled, arrowhead), identified by its size, and adjacent GMCs (arrow) express En. (F) Schematic of transcription factor expression in lineage 3. Dashed lines, lineage boundaries. Anterior, up; white bar, midline. Scale bars: 10 μm.
Fig. 5.
Fig. 5.
Msh and Lim3 label the A and B hemilineages of lineage 9. (A-D) Lineage 9 wild-type (A,B), spdo mutant (C) and numb mutant (D) MARCM clones labeled for the indicated proteins in late third instar larva. (A) Most lineage 9 neurons project axons ipsilaterally (arrow, 9i), but a few extend axons contralaterally (arrowheads, 9c). (B) Msh (red) and Lim3 (blue) are expressed in distinct lineage 9 neurons. (C) spdo mutant MARCM clone labeled for Lim3; arrowhead indicates Lim3- NB and GMCs. (D) numb mutant MARCM clone labeled for Msh; arrows point to ipsilaterally projecting axons. Asterisks denote GFP+ axons from cells not located in relevant clone. Arrowheads point to large NB-like cells, which are often duplicated in numb clones (Truman et al., 2010). (E) Portion of thoracic hemineuromere of late third instar larva labeled for Lim3 (green) and Islet (red). Lineage 9 neurons are the lateral-most Lim3+ neurons in a hemineuromere and co-express Islet; Islet expression in lineage 17a neurons is also shown. (F) Schematic of transcription factor expression in lineage 9. Dashed lines, lineage boundaries. White bar, midline. Scale bars: 10 μm.
Fig. 6.
Fig. 6.
Unc4 and Nkx6 label the A and B hemilineages of lineage 12. (A-C) Lineage 12 wild-type (A), numb mutant (B) or spdo mutant (C) MARCM clones labeled for the indicated proteins in late third instar larvae. (A) A wild-type lineage 12 clone contains Unc4+ neurons and extends a contralateral projection (12c) and forked ipsilateral projections (12i). Some neurons in the clone do not express Unc4 as shown in a single z-section (inset). (B) numb mutant MARCM clone labeled for Unc4. (C) spdo mutant MARCM clone labeled for Nkx6. (D-F) Wild-type lineage 12 MARCM clones labeled for the indicated proteins; arrowheads point to NBs, which are encircled by solid lines. The Nkx6+ cell (asterisk, F) does not reside in the clone. (G) Schematic of transcription factor expression in lineage 12. (H,I) Nkx6 expression (red) in a thoracic neuromere of a wild-type late third instar larva (H) and a late third instar larva in which Unc4 was expressed in all neurons (I): the location or expected location of Nkx6+ neurons of lineage 3 and 12 are circled. Dashed lines, lineage boundaries (A-F) or predicted boundaries (H,I). Anterior, up; white bar, midline. Scale bars: 10 μm.
Fig. 7.
Fig. 7.
Schematic models of transcription factor expression in postembryonic neuronal lineages. (A) Transcription factor expression in each postembryonic lineage. Large gray ovals denote leg neuropils; black and gray lines denote commissures. Green circles represent A hemilineage neurons (NotchON); purple circles represent B hemilineage neurons (NotchOFF). Empty circles represent hemilineages that die. Schematic reproduced with permission (Truman et al., 2010). (B) Schematic of transcription factor expression in postembryonic lineages in one thoracic neuromere. Left half of circles represents the ‘A’ hemilineage; right half represents the B hemilineage. Anterior, up; dotted line, midline. Dark gray shading represents the dorsal region of hemisegment.
Fig. 8.
Fig. 8.
Nkx6 is necessary and sufficient to direct axonal pathway selection in lineage 3. (A) A lineage 3 wild-type MARCM clone extends two axon bundles: 3id and 3il. (B) A lineage 3 nkx6 mutant MARCM clone contains the 3id bundle, but lacks the 3il bundle. (C) A lineage 3 MARCM clone that overexpresses nkx6 contains the 3il bundle, but lacks the 3id bundle. (D) A lineage 3 MARCM clone that overexpresses Unc4 extends three axon bundles. (E) A lineage 12 wild-type MARCM clone (E). Scale bars: 10 μm. Anterior, up; white bar, midline.

References

    1. Betschinger J., Knoblich J. A. (2004). Dare to be different: asymmetric cell division in Drosophila, C. elegans and vertebrates. Curr. Biol. 14, R674–R685 - PubMed
    1. Bossing T., Udolph G., Doe C. Q., Technau G. M. (1996). The embryonic central nervous system lineages of Drosophila melanogaster. I. Neuroblast lineages derived from the ventral half of the neuroectoderm. Dev. Biol. 179, 41–64 - PubMed
    1. Brand A. H., Perrimon N. (1993). Targeted gene expression as a means of altering cell fates and generating dominant phenotypes. Development 118, 401–415 - PubMed
    1. Britton J. S., Edgar B. A. (1998). Environmental control of the cell cycle in Drosophila: nutrition activates mitotic and endoreplicative cells by distinct mechanisms. Development 125, 2149–2158 - PubMed
    1. Broihier H. T., Skeath J. B. (2002). Drosophila homeodomain protein dHb9 directs neuronal fate via crossrepressive and cell-nonautonomous mechanisms. Neuron 35, 39–50 - PubMed

Publication types

MeSH terms