. 2014 Feb;26(2):828-41.
doi: 10.1105/tpc.113.121111. Epub 2014 Feb 18.

The bHLH transcription factor HBI1 mediates the trade-off between growth and pathogen-associated molecular pattern-triggered immunity in Arabidopsis

Affiliations

The bHLH transcription factor HBI1 mediates the trade-off between growth and pathogen-associated molecular pattern-triggered immunity in Arabidopsis

Min Fan et al. Plant Cell. 2014 Feb.

Abstract

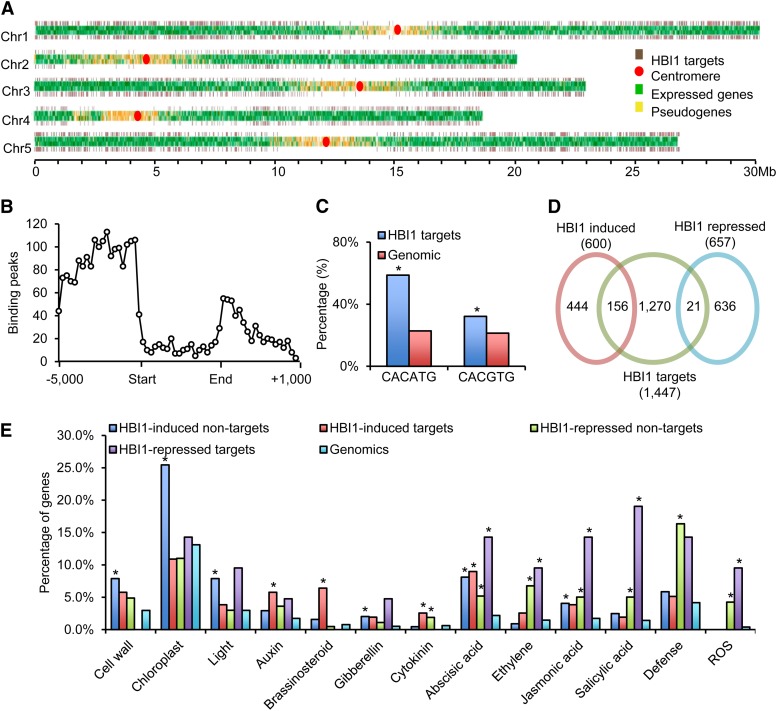
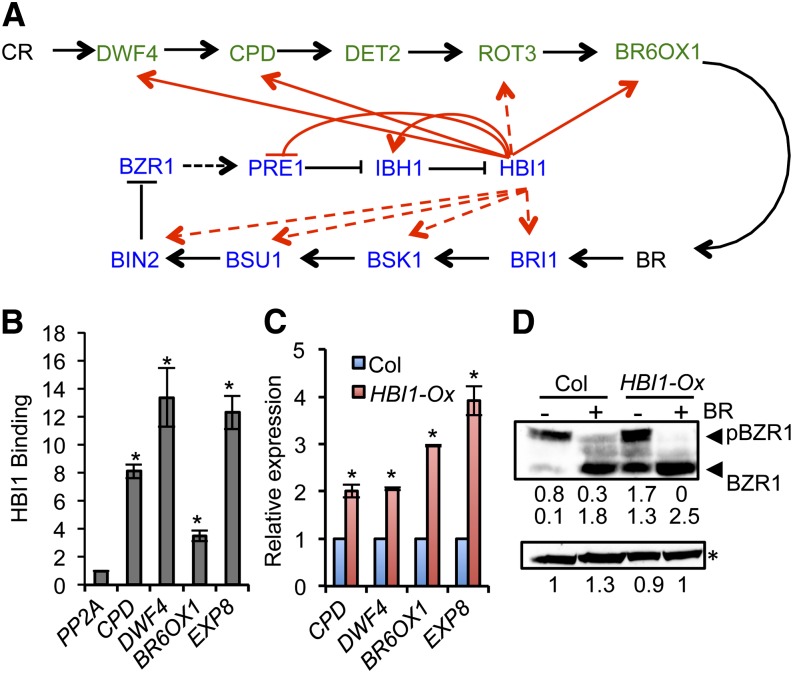
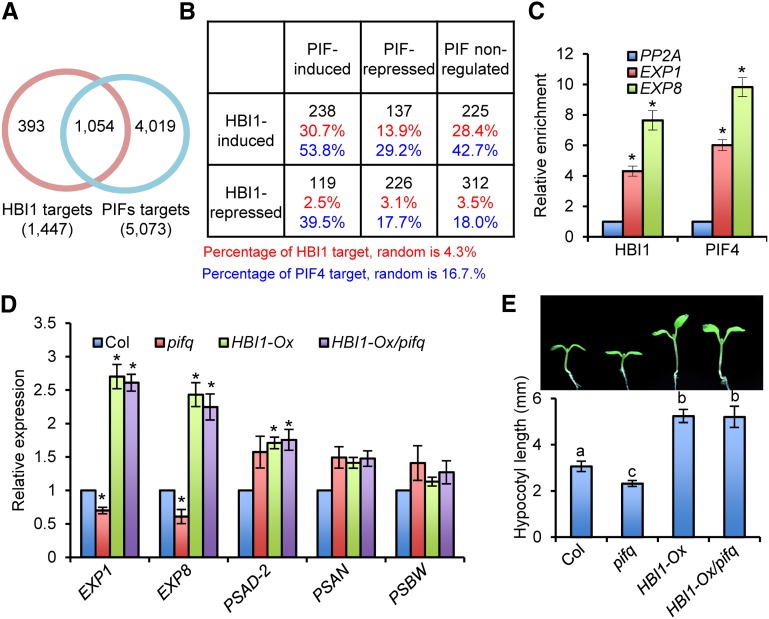
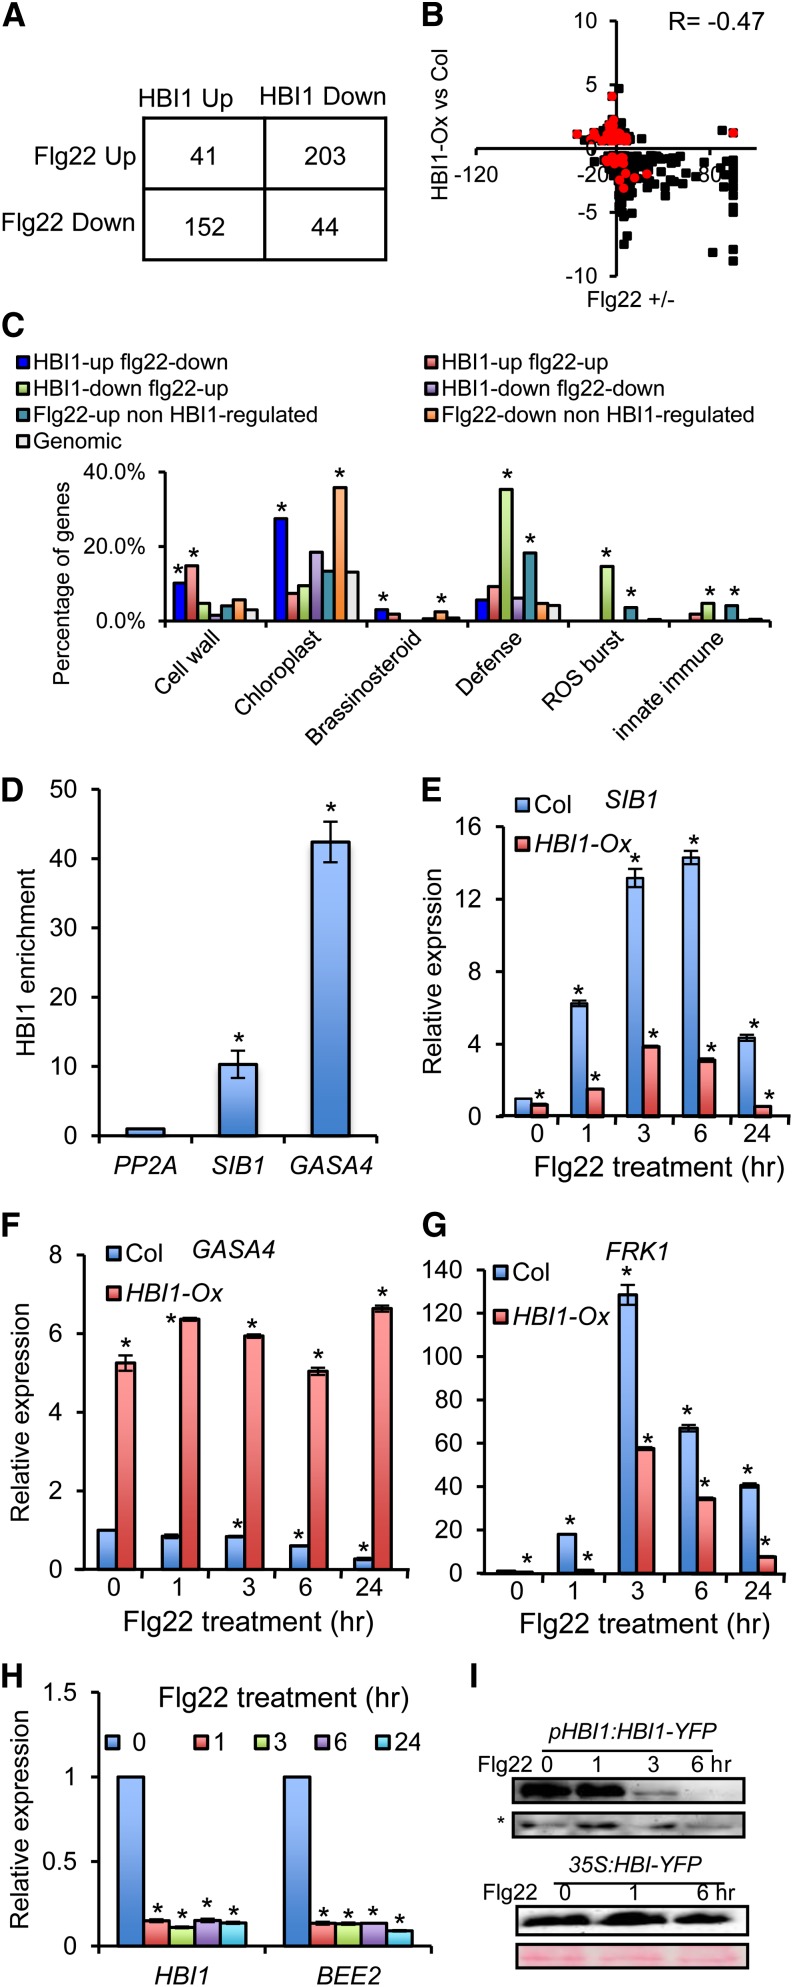
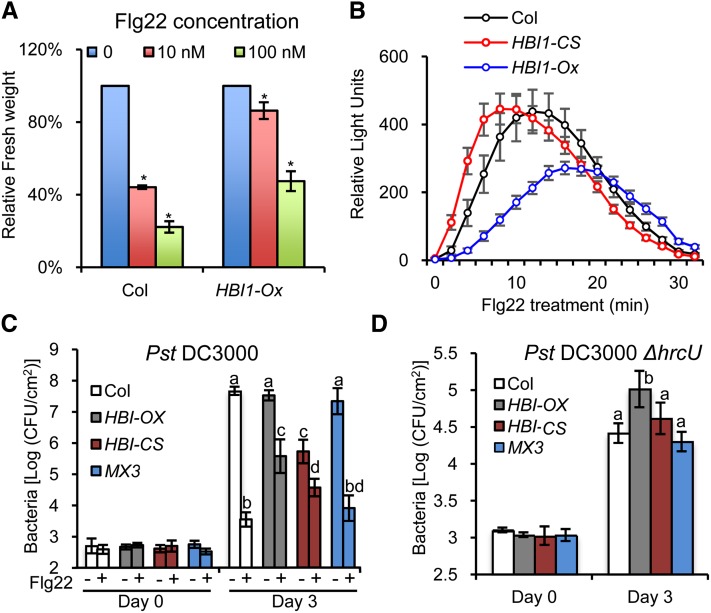
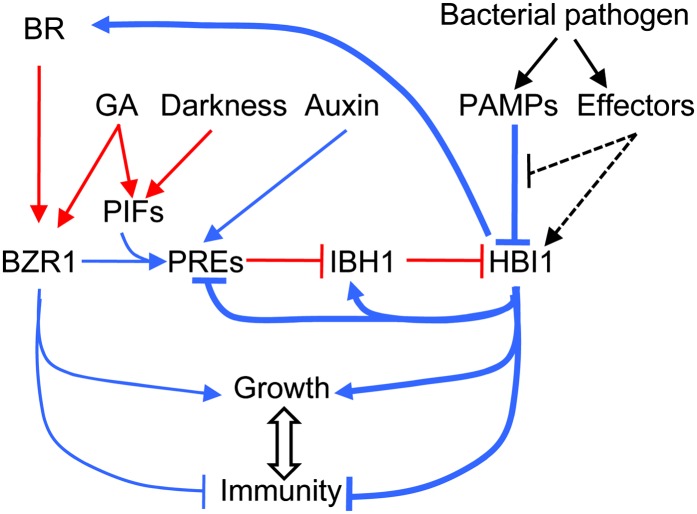
The trade-off between growth and immunity is crucial for survival in plants. However, the mechanism underlying growth-immunity balance has remained elusive. The PRE-IBH1-HBI1 tripartite helix-loop-helix/basic helix-loop-helix module is part of a central transcription network that mediates growth regulation by several hormonal and environmental signals. Here, genome-wide analyses of HBI1 target genes show that HBI1 regulates both overlapping and unique targets compared with other DNA binding components of the network in Arabidopsis thaliana, supporting a role in specifying network outputs and fine-tuning feedback regulation. Furthermore, HBI1 negatively regulates a subset of genes involved in immunity, and pathogen-associated molecular pattern (PAMP) signals repress HBI1 transcription. Constitutive overexpression and loss-of-function experiments show that HBI1 inhibits PAMP-induced growth arrest, defense gene expression, reactive oxygen species production, and resistance to pathogen. These results show that HBI1, as a component of the central growth regulation circuit, functions as a major node of crosstalk that mediates a trade-off between growth and immunity in plants.


Figures

Figure 1.
Figure 1.
Genome-wide Identification of HBI1 Binding and Regulated Genes. (A) Distribution of HBI1 binding sites along the five chromosomes of Arabidopsis. The HBI1 target genes are depicted by brown bars, normal expressed genes are depicted by green bars, and pseudogenes are depicted by yellow bars. A red circle indicates the location of the centromere. (B) Distribution of HBI1 binding peaks (frequency) relative to gene structure (−5 kb to +1 kb downstream of 3′ end). (C) Frequency of shown cis-elements around HBI1 binding regions. Asterisk indicates significant difference from random genome (Fisher’s exact test; *P < 0.05). (D) Venn diagram showing the overlap between the HBI1-regulated genes and HBI1 direct target genes. (E) Gene Ontology analyses of HBI1 directly and indirectly regulated genes. Numbers indicate the percentages of genes belonging to each Gene Ontology category. Asterisk indicates significant difference from random genome (Fisher’s exact test; *P < 0.05).
Figure 2.
Figure 2.
HBI1 Positively Regulates Components of the BR Pathway. (A) A diagram of BR pathway. The BR biosynthetic enzymes are shown in green, and the BR signaling components are in blue. Black arrows and bar ends show activation and inhibition at the protein level. Red arrows show HBI1 binding to the promoter of these genes, with solid lines indicating HBI1 activation and dashed lines indicating no evidence for HBI1 regulation according to our RNA-Seq data. (B) Quantitative ChIP-PCR analysis of HBI1 binding to the promoter of selected genes. The chromatin of pHBI1:HBI1-YFP and 35S:YFP transgenic plants was immunoprecipitated with anti-YFP antibody, and the precipitated DNA was quantified by quantitative PCR. Enrichment of DNA was calculated as the ratio between pHBI1:HBI1-YFP and 35S:YFP, normalized to that of the PP2A coding region. Error bars indicate standard deviation of three biological repeats. Asterisk indicates significant difference from control gene PP2A (t test; *P < 0.05). (C) qRT-PCR analysis of the expression of BR biosynthetic genes in the wild-type (Columbia [Col]) and HBI1-Ox. Error bars indicate standard deviation of three biological repeats. Asterisk indicates significant difference from wild-type control (t test; *P < 0.05). (D) Anti-BZR1 immunoblot analysis of BZR1 phosphorylation status in 4-week-old plants. The relative band intensity was quantified by ImageJ software and labeled under the gel. Asterisk indicates the nonspecific bands to show equal loading. Experiment was repeated four times with similar results.
Figure 3.
Figure 3.
HBI1 and PIF Have Overlapping and Distinct Functions. (A) Venn diagram showing the overlap between HBI1 target genes and PIF target genes. The PIF target genes include the genes associated with PIF1, PIF3, PIF4, or PIF5. (B) The table shows the overlap of HBI1-regulated genes and PIF-regulated genes and the percentage of HBI1 target genes or PIFs target genes among the gene sets that HBI1 and/or PIFs regulate. The top black numbers are the numbers of genes regulated by HBI1 and/or PIFs, the middle red numbers are the percentage of HBI1 targets, and the bottom blue numbers are the percentage of PIF targets. (C) ChIP-qPCR analysis of HBI1 and PIF4 binding to the promoters of selected genes. Chromatin immunoprecipitation was performed with anti-YFP antibody or anti-Myc antibody using pHBI1:HBI1-YFP, 35S:YFP, pPIF4:PIF4-myc/pifq, and pifq plants grown in the dark for 5 d. Enrichment of DNA was calculated as the ratio between pHBI1:HBI1-YFP and 35S:YFP, or pPIF4:PIF4-myc/pifq and pifq, normalized to that of the PP2A coding region as the internal control. Error bars indicate standard deviation of three biological repeats. Asterisks indicate significant difference from control gene PP2A (t test; *P < 0.05). (D) qRT-PCR analyses of EXP1, EXP8, PSAD-2, PSAN, and PSBW mRNA levels in wild-type (Col), pifq, and HBI1-Ox/pifq plants. PP2A was used as the internal control. Error bars indicate standard deviation from three biological repeats. Asterisks indicate significant difference from the wild type (t test; *P < 0.05). (E) Overexpression of HBI1 rescues the dwarf phenotype of pifq. The top picture shows Columbia, pifq, HBI1-Ox, and HBI1-Ox/pifq grown for 7 d under constant light. Bottom graph shows the quantification of hypocotyl lengths. Error bars indicate standard deviation from 20 biological repeats. Different letters indicate statistically significant differences between the samples (t test, P < 0.05).
Figure 4.
Figure 4.
HBI1 and Flg22 Oppositely Regulate Gene Expression. (A) Overlaps between gene sets regulated by HBI1 and flg22. (B) Scatterplot of log2 fold change values of the genes coregulated by HBI1 and flg22. Red color indicates the HBI1 target genes. Col, Columbia. (C) GO analyses of gene sets regulated by HBI1 and/or flg22. Numbers indicate the percentage of genes belonging to each GO category. Asterisk indicates significant difference from random genome (Fisher’s exact test; *P < 0.05). (D) Quantitative ChIP-PCR analysis of the HBI1 enrichment in the promoter of selected genes. The chromatin of pHBI1:HBI1-YFP and 35S:YFP transgenic plants was immunoprecipitated with anti-YFP antibody, and the precipitated DNA was quantified by quantitative PCR. Enrichment of DNA was calculated as the ratio between pHBI1:HBI1-YFP and 35S:YFP, normalized to that of the PP2A coding region. Error bars indicate standard deviation from three biological repeats. Asterisk indicates significant difference from control gene PP2A (t test; *P < 0.05). (E) to (G) qRT-PCR analysis of flg22-regulated gene expression in wild-type (Col) and HBI1-Ox seedlings. Error bars indicate standard deviation from three biological repeats. Asterisk indicates significant difference from the wild type with mock treatment (t test; *P < 0.05). (H) qRT-PCR analyses of flg22 effect on the expression of HBI1 and BEE2. PP2A was used as the internal control. Error bars indicate standard deviation from three biological repeats. Asterisk indicates significant difference from the wild type with mock treatment (t test; *P < 0.05). (I) Flg22 treatment reduces the HBI1-YFP protein accumulation in the pHBI1:HBI1-YFP but not 35S:HBI1-YFP plants. The immunoblots were analyzed using anti-YFP antibody. The nonspecific band (asterisk) and Ponceau S staining were used to show the equal loading.
Figure 5.
Figure 5.
HBI1 Negatively Regulates PTI Signaling. (A) HBI1-Ox plants show reduced sensitivity to Flg22-induced growth inhibition. Growth is represented relative to untreated plants. Error bars indicate standard deviation from three biological repeats. Asterisk indicates significant difference from mock treatment (t test; *P < 0.05). (B) Oxidative burst triggered after flg22 treatment (100 nM) in wild-type, HBI1-CS, and HBI1-Ox plants. Error bars indicate standard deviation from three biological repeats. (C) Pst DC3000 growth in Columbia (Col) wild-type, HBI-Ox, HBI1-CS, and pBZR1:bzr1-1D-CFP (MX3) plants pretreated with 1 µM flg22 or water. Leaves were inoculated with105 colony-forming units (CFU)/mL of bacteria. Bacterial growth was quantified at 0 and 3 d after inoculation. Data points represent mean log (colony-forming units/cm2). Error bars indicate standard deviation from 12 biological repeats. Different letters above the day 3 bars indicate statistically significant differences between the samples (one-way analysis of variance and Tukey's honestly significant difference test, P < 0.05). (D) Pst DC3000ΔhrcU growth in Columbia wild-type, HBI-Ox, HBI1-CS, and MX3 plants. Leaves were inoculated with 2 × 10⁵ colony-forming units/mL of bacteria. Bacterial growth was quantified at 0 and 3 d after inoculation. Data points represent mean log (colony-forming units/cm2). Error bars indicate standard deviation from 12 biological repeats. Different letters above day 3 bars indicate statistically significant differences between the samples (one-way analysis of variance and Tukey's honestly significant difference test, P < 0.05).
Figure 6.
Figure 6.
Diagram of the Signaling Network Integrating Hormonal, Biotic, and Abiotic Signals. HBI1 is activated posttranscriptionally by growth-promoting hormonal and environmental signals through the PRE-IBH1-HBI1 cascade but is repressed transcriptionally by PAMP signals. HBI1 both activates growth and inhibits immunity, thereby acting as a crosstalk node that mediates the trade-off between growth and immunity. Arrows show activation, bar-ended lines show inhibition, red lines show regulation by protein–protein interactions, blue lines show transcriptional regulation, and the dashed lines show hypothetical mechanisms. The mechanisms elucidated in this study are marked by thick lines.

References

    1. Albrecht C., Boutrot F., Segonzac C., Schwessinger B., Gimenez-Ibanez S., Chinchilla D., Rathjen J.P., de Vries S.C., Zipfel C. (2012). Brassinosteroids inhibit pathogen-associated molecular pattern-triggered immune signaling independent of the receptor kinase BAK1. Proc. Natl. Acad. Sci. USA 109: 303–308. - PMC - PubMed
    1. Anders S., Huber W. (2010). Differential expression analysis for sequence count data. Genome Biol. 11: R106. - PMC - PubMed
    1. Bai M.Y., Fan M., Oh E., Wang Z.Y. (2012a). A triple helix-loop-helix/basic helix-loop-helix cascade controls cell elongation downstream of multiple hormonal and environmental signaling pathways in Arabidopsis. Plant Cell 24: 4917–4929. - PMC - PubMed
    1. Bai M.Y., Shang J.X., Oh E., Fan M., Bai Y., Zentella R., Sun T.P., Wang Z.Y. (2012b). Brassinosteroid, gibberellin and phytochrome impinge on a common transcription module in Arabidopsis. Nat. Cell Biol. 14: 810–817. - PMC - PubMed
    1. Belkhadir Y., Jaillais Y., Epple P., Balsemão-Pires E., Dangl J.L., Chory J. (2012). Brassinosteroids modulate the efficiency of plant immune responses to microbe-associated molecular patterns. Proc. Natl. Acad. Sci. USA 109: 297–302. - PMC - PubMed

Publication types

MeSH terms

Associated data