. 2014 Apr;164(4):2054-67.
doi: 10.1104/pp.113.233429. Epub 2014 Feb 18.

Apyrase suppression raises extracellular ATP levels and induces gene expression and cell wall changes characteristic of stress responses

Affiliations

Apyrase suppression raises extracellular ATP levels and induces gene expression and cell wall changes characteristic of stress responses

Min Hui Lim et al. Plant Physiol. 2014 Apr.

Abstract

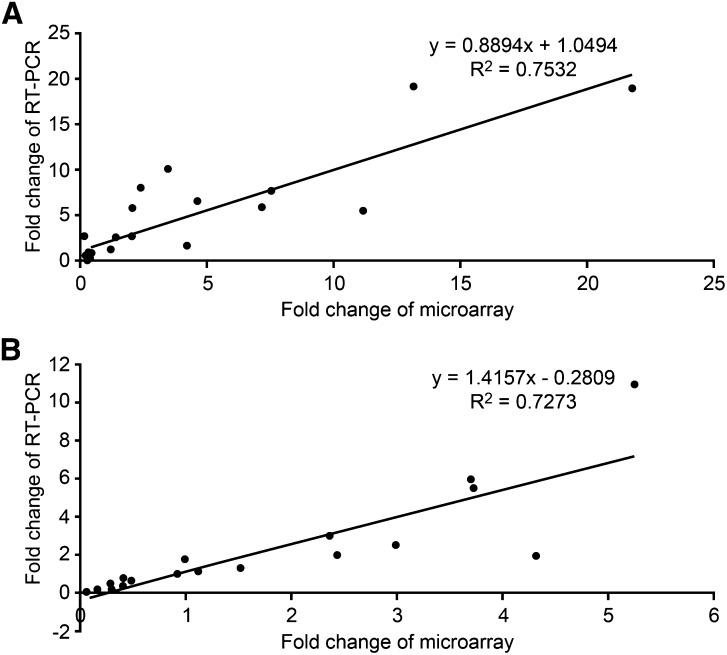
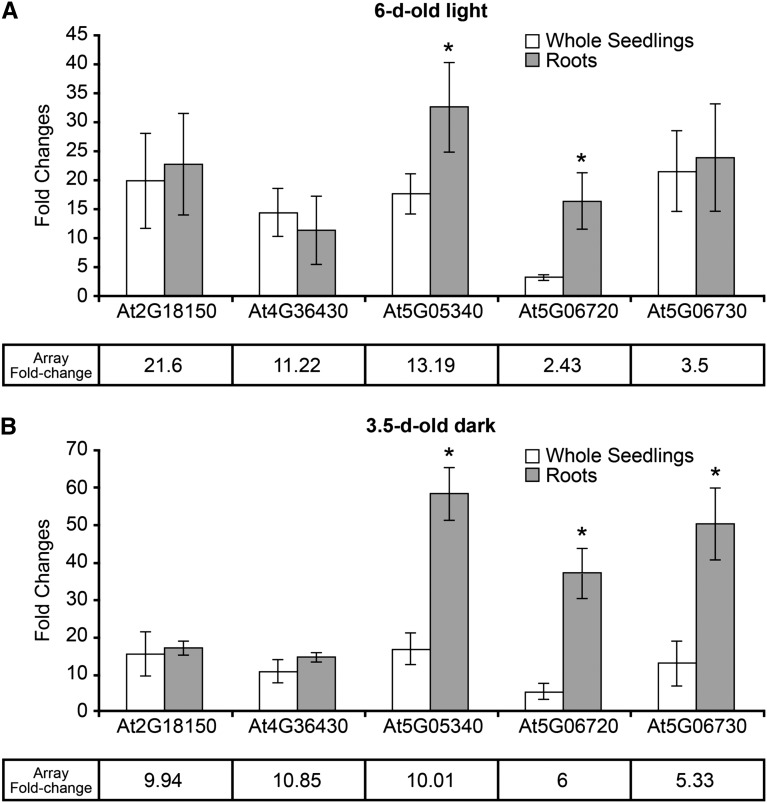
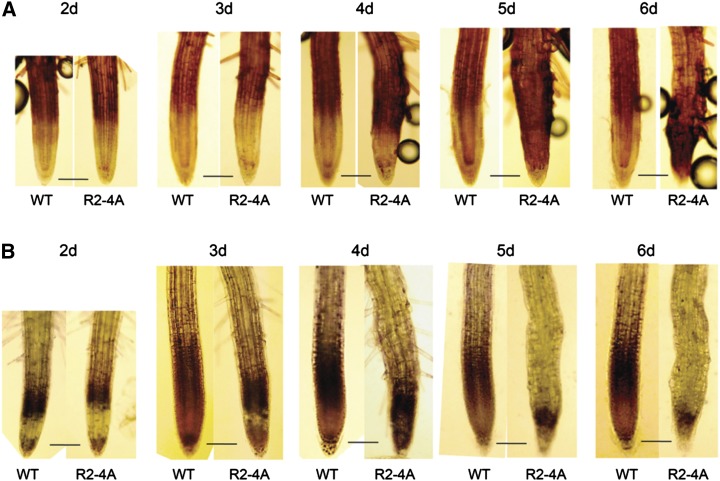
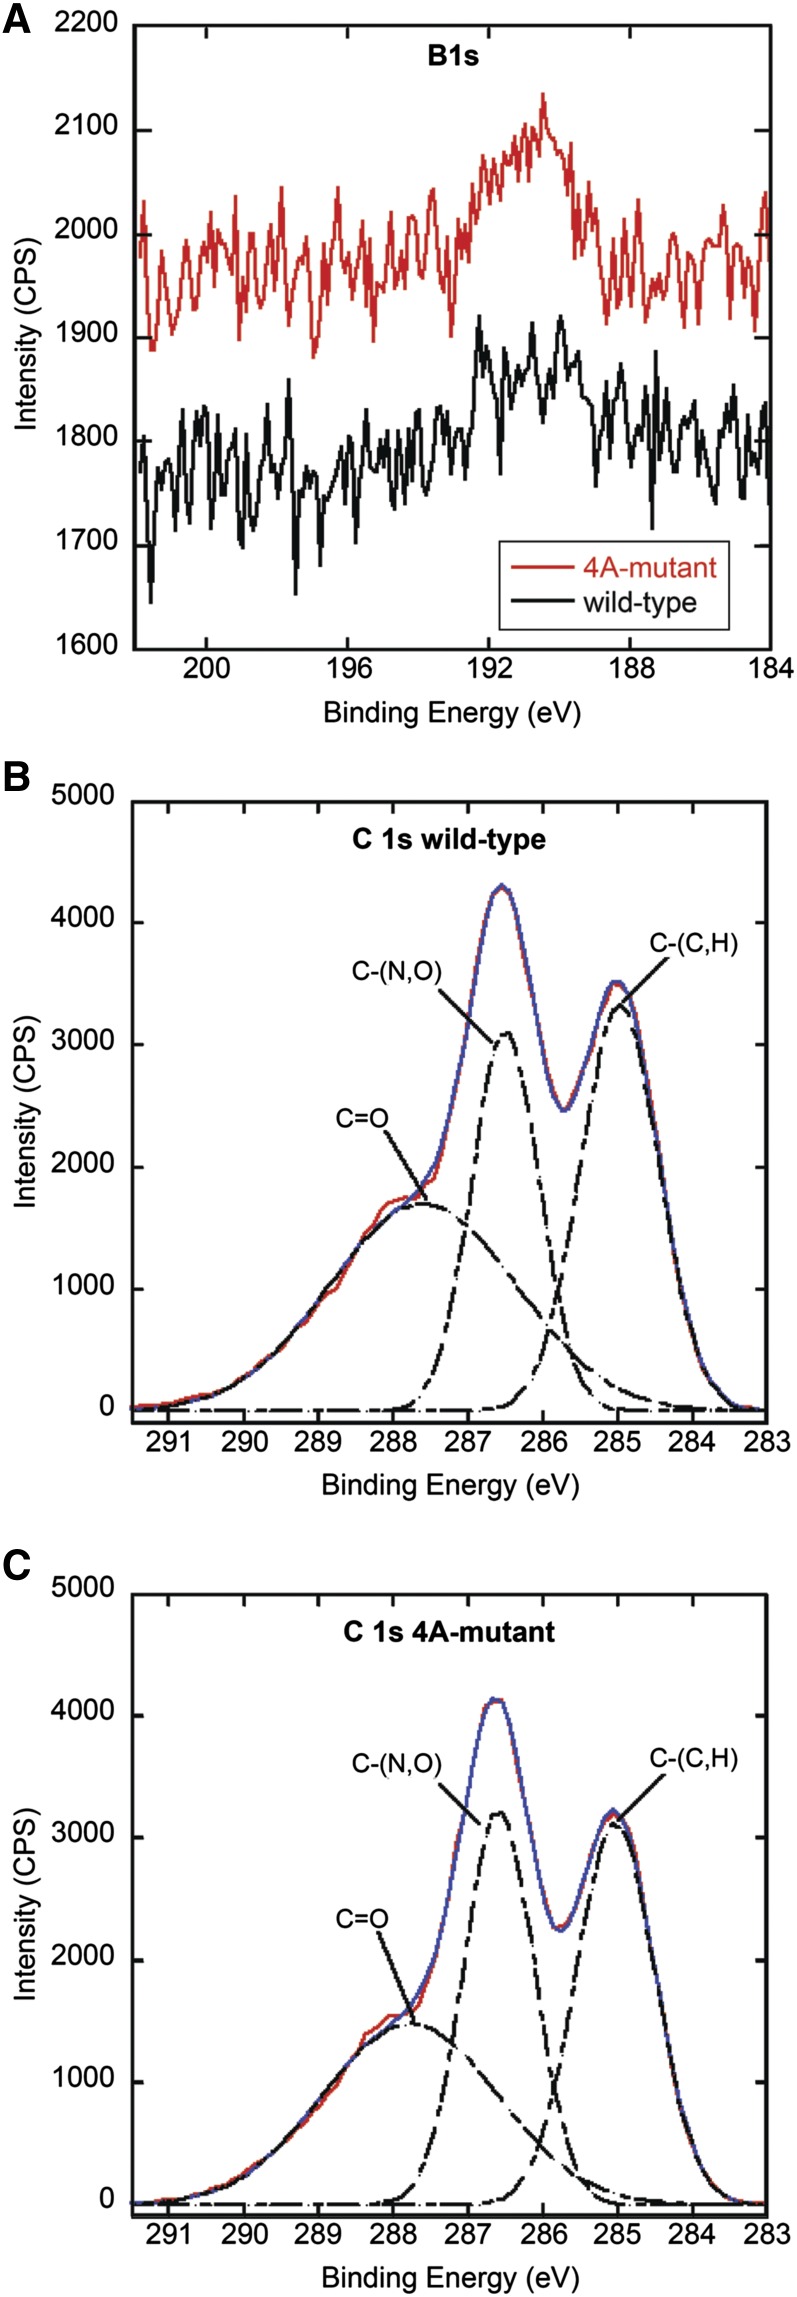
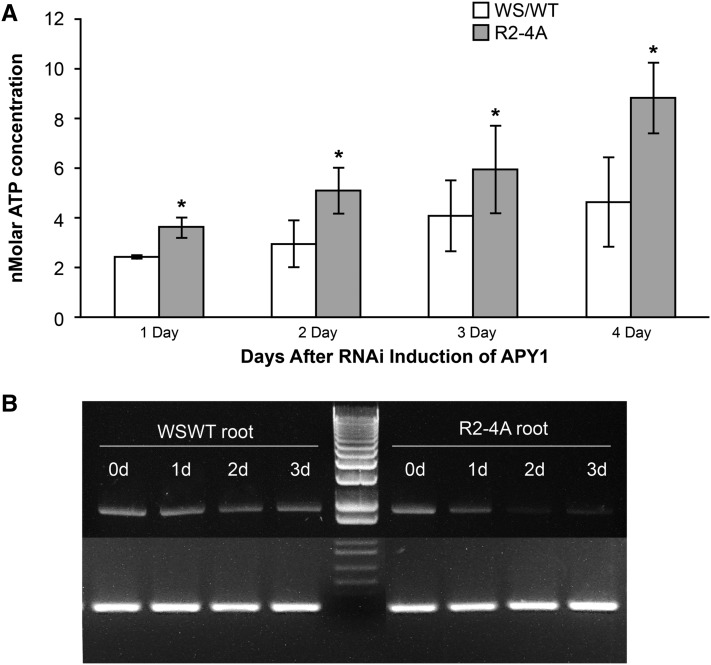
Plant cells release ATP into their extracellular matrix as they grow, and extracellular ATP (eATP) can modulate the rate of cell growth in diverse tissues. Two closely related apyrases (APYs) in Arabidopsis (Arabidopsis thaliana), APY1 and APY2, function, in part, to control the concentration of eATP. The expression of APY1/APY2 can be inhibited by RNA interference, and this suppression leads to an increase in the concentration of eATP in the extracellular medium and severely reduces growth. To clarify how the suppression of APY1 and APY2 is linked to growth inhibition, the gene expression changes that occur in seedlings when apyrase expression is suppressed were assayed by microarray and quantitative real-time-PCR analyses. The most significant gene expression changes induced by APY suppression were in genes involved in biotic stress responses, which include those genes regulating wall composition and extensibility. These expression changes predicted specific chemical changes in the walls of mutant seedlings, and two of these changes, wall lignification and decreased methyl ester bonds, were verified by direct analyses. Taken together, the results are consistent with the hypothesis that APY1, APY2, and eATP play important roles in the signaling steps that link biotic stresses to plant defense responses and growth changes.


Figures

Figure 1.
Figure 1.
Correlation analyses between real-time qRT-PCR and microarray results. qRT-PCR was used to validate the two microarray datasets. A, Result of standard linear regression analysis between the fold changes observed in apyrase-suppressed light-grown plants by real-time qRT-PCR (x axis) and microarray analyses (y axis). B, Result of standard linear regression analysis between the fold changes observed in apyrase-suppressed dark-grown plants by real-time qRT-PCR (x axis) and microarray data (y axis). The calculated equation and correlation value (R²) is shown along with the regression line.
Figure 2.
Figure 2.
Transcript abundance of five genes encoding type III wall peroxidases in whole seedlings and roots increases in R2-4A mutants suppressed in their expression of APY1 and APY2. A, qRT-PCR results of the transcript abundance changes of five peroxidase genes in light-grown 6-d-old seedlings. B, qRT-PCR results of the transcript abundance changes of five peroxidase genes in dark-grown 3.5-d-old seedlings. Fold changes for each gene in microarray analysis are also presented in each graph. Error bars represent sd. At least three biological repeats were performed for this experiment. An asterisk indicates value is significantly different (P < 0.05) from value of adjoining bar.
Figure 3.
Figure 3.
Higher reactive oxygen species (ROS) levels are induced in R2-4A roots when APY1 and APY2 are suppressed. A, H2O2 levels in wild-type (WT) and R2-4A roots from 2 to 6 d after estradiol treatment. DAB was used to stain H2O2. B, Superoxide levels in WT and R2-4A roots from 2 to 6 d. Nitroblue tetrazolium was used to stain superoxide. Images are representative of at least three biological repeats. Bar = 100 μm. [See online article for color version of this figure.]
Figure 4.
Figure 4.
Higher lignin levels are induced in R2-4A roots when APY1 and APY2 are suppressed. Lignin staining of 6-d-old roots with phloroglucinol in wild-type (A) and R2-4A (B) roots. Magenta color indicates lignin. Cross sections of wild-type (C) and R2-4A (D) roots stained with phloroglucinol. Cross sections are from regions ∼200 to 600 μm from root tip, where vascular tissue is not fully matured in wild type. Lignin autofluorescence of wild type (E) and R2-4A (F). Images are representative of at least three biological repeats. Bars in A and B = 100 μm. Bars in C and D = 10 μm. Bars in E and F = 50 μm.
Figure 5.
Figure 5.
Cell walls of Arabidopsis isolated from R2-4A mutants suppressed in their expression of APY1 and APY2 have altered FTIR spectra, indicating fewer methyl ester linkages. A, Averaged FTIR spectra for wild-type (black) and R2-4A mutant (red) samples both computed using 13 spectra. Each of the spectra was obtained from 100 scans at a resolution of 4 cm−1. The averaged spectra were normalized to the maximum intensity peak at 1,056 cm−1 and then baseline corrected. Dashed lines are added to highlight differences in the two spectra at 1,251 and 1,741 cm−1. B, PCA of wild-type (black squares) and mutant (red circles) samples. PC1 is plotted against PC3, accounting for 99.3% of the variance. Each point on the figure represents 1 of 13 peaks selected for analysis (1,035, 1,057, 1,111, 1,161, 1,207, 1,251, 1,319, 1,336, 1,374, 1,431, 1,516, 1,648, and 1,741 cm−1). C, An average spectrum of the 4A mutant samples (black) is shown here with 17 fitted Gaussian curves along with the total Gaussian fit (red). The Gaussian fits associated with stretches arising from methyl ester groups are highlighted in green (1,742 cm−1) and blue (1,234 cm−1), which correspond to C = O and O-C-O vibrations, respectively.
Figure 6.
Figure 6.
Cell walls of Arabidopsis isolated from R2-4A mutants suppressed in their expression of APY1 and APY2 have altered x-ray photoelectron spectra, indicating more boron linkages. A, X-ray photoelectron spectra of the B 1s region showing a peak near 190 eV for wild-type (black) and mutant (red) samples. Scans were taken at a resolution of 0.1 eV, a 300-ms dwell time, and a detector aperture of 160 mm. The C 1s region of x-ray photoelectron spectra of wild-type (B) and R2-4A-mutant (C) cell walls taken at a resolution of 0.1 eV, a dwell time of 3,000 ms, and a detector aperture of 20 mm. Spectral decomposition was done by fitting the peaks to Gaussian curves. The baseline corrected result is shown in red, Gaussian fit is in blue, and peak composites are dashed lines. The aliphatic carbon [C-(C,H)] peak was adjusted to 285 eV to account for binding energy shifts caused by the use of a charge neutralizer. Peaks at 286.6 and 287.8 eV correspond to C-(N,O) and C = O functional groups, respectively. When measured with respect to the 285-eV signal, the R2-4A mutant sample shows a 20% increase in the 286.6-eV peak over the wild type. CPS, Copalyl diphosphate synthase.
Figure 7.
Figure 7.
Media [eATP] rises with increased suppression of apyrase expression in R2-4A seedlings. A, Time course of increase of [ATP] in seedling growth media based on luciferase assay luminescence compared with the ATP standard curve. Error bars represent sd. An asterisk indicates statistical significance based on P value > 0.05 in a Student’s t test. B, Time course of loss of APY1 transcripts during continuous treatment of R2-4A mutants with estradiol inducer of RNAi construct. WS/WT, Ws cultivar, wild-type.

References

    1. Almagro L, Gómez Ros LV, Belchi-Navarro S, Bru R, Ros Barceló A, Pedreño MA. (2009) Class III peroxidases in plant defence reactions. J Exp Bot 60: 377–390 - PubMed
    1. Aquea F, Federici F, Moscoso C, Vega A, Jullian P, Haseloff J, Arce-Johnson P. (2012) A molecular framework for the inhibition of Arabidopsis root growth in response to boron toxicity. Plant Cell Environ 35: 719–734 - PubMed
    1. Bouwmeester K, Han M, Blanco-Portales R, Song W, Weide R, Guo LY, van der Vossen EAG, Govers F. (2014) The Arabidopsis lectin receptor kinase LecRK-I.9 enhances resistance to Phytophthora infestans in Solanaceous plants. Plant Biotechnol J 12: 10–16 - PubMed
    1. Chen YF, Shakeel SN, Bowers J, Zhao XC, Etheridge N, Schaller GE. (2007) Ligand-induced degradation of the ethylene receptor ETR2 through a proteasome-dependent pathway in Arabidopsis. J Biol Chem 282: 24752–24758 - PubMed
    1. Chiu TY, Christiansen K, Moreno I, Lao JM, Loqué D, Orellana A, Heazlewood JL, Clark G, Roux SJ. (2012) AtAPY1 and AtAPY2 function as Golgi-localized nucleoside diphosphatases in Arabidopsis thaliana. Plant Cell Physiol 53: 1913–1925 - PubMed

Publication types

MeSH terms