. 2014 Feb 18:3:e01460.
doi: 10.7554/eLife.01460.

miR-146a promotes the initiation and progression of melanoma by activating Notch signaling

Affiliations

miR-146a promotes the initiation and progression of melanoma by activating Notch signaling

Matteo Forloni et al. Elife. .

Abstract

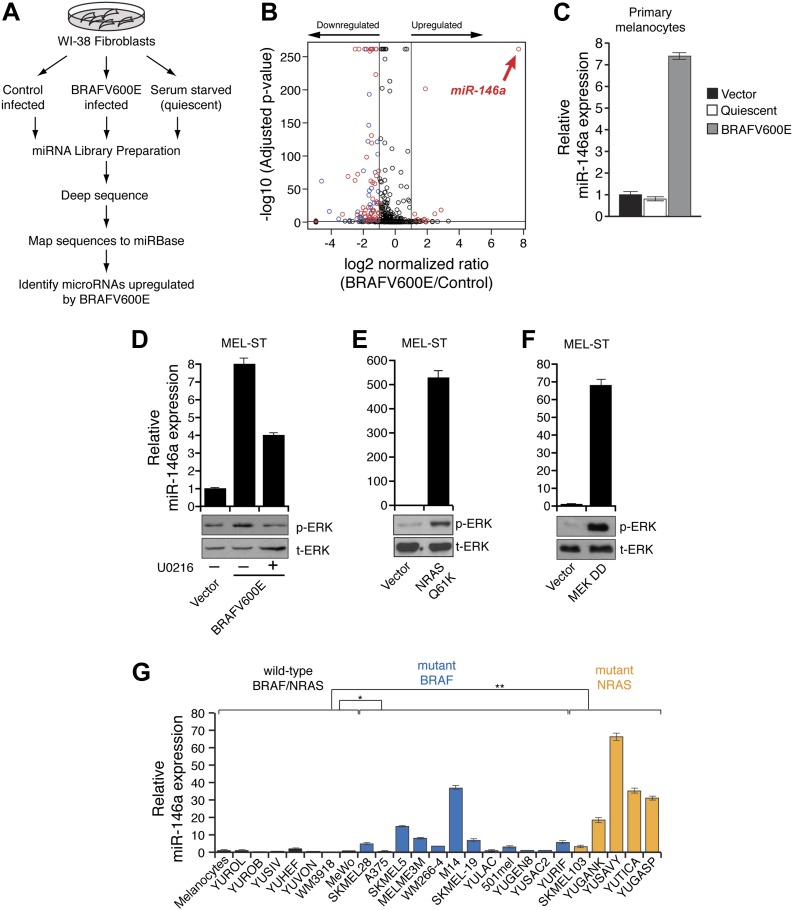
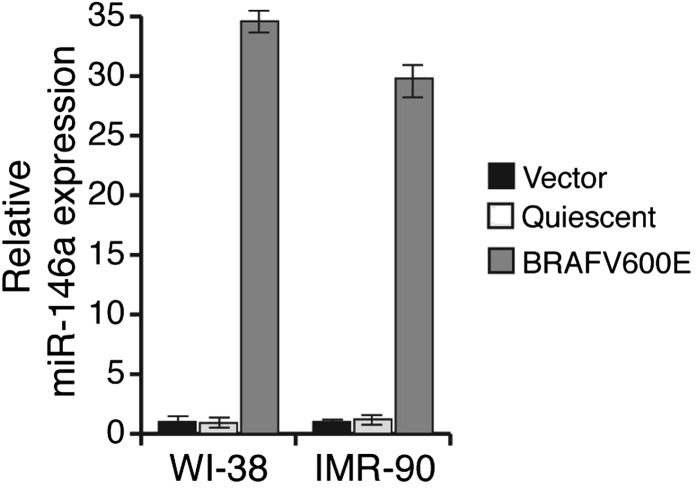
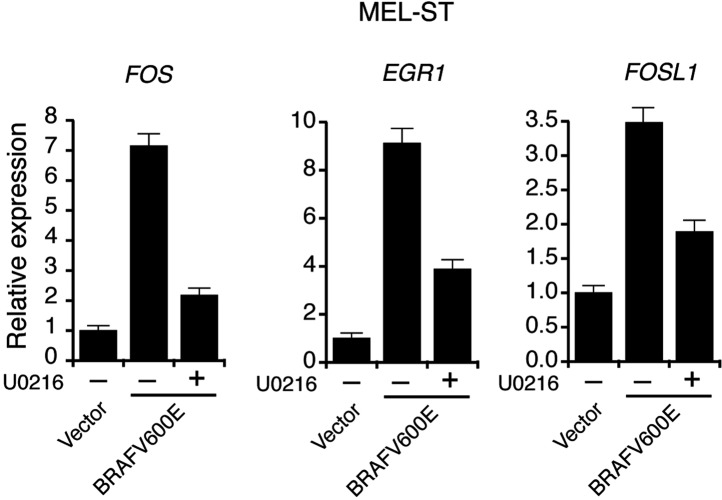
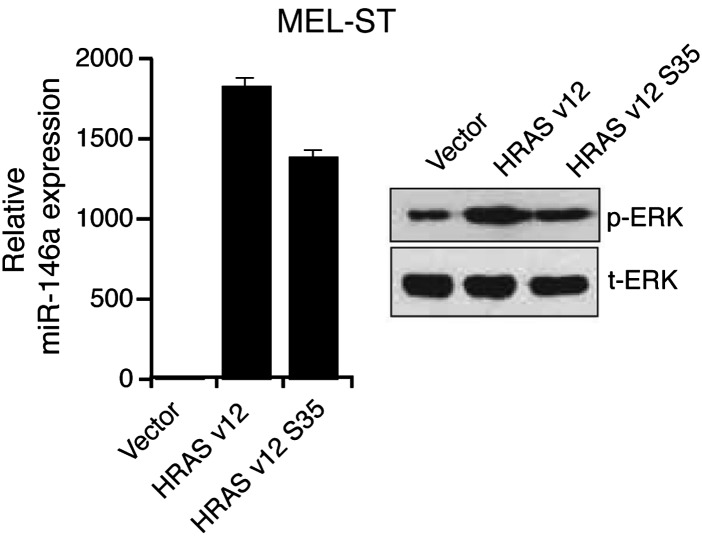
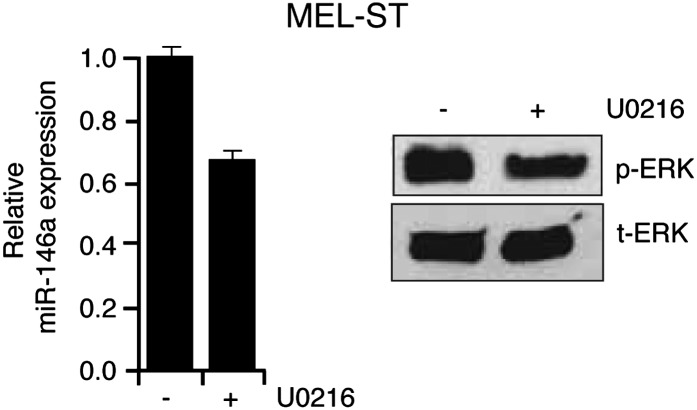
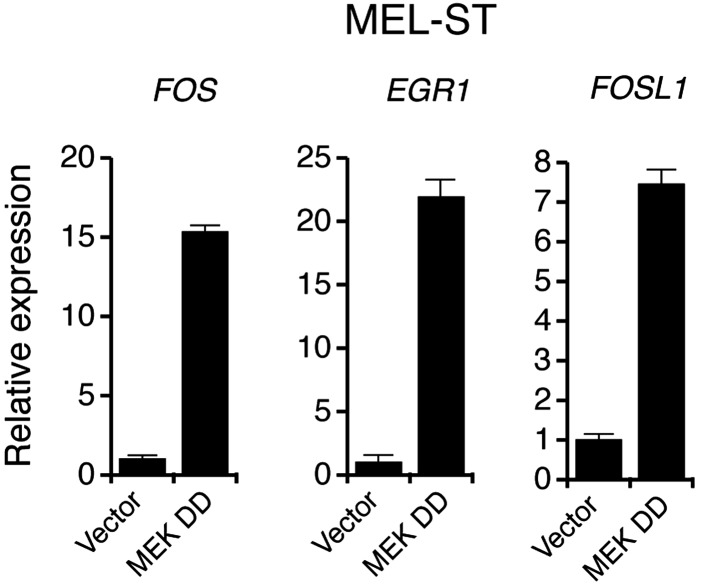
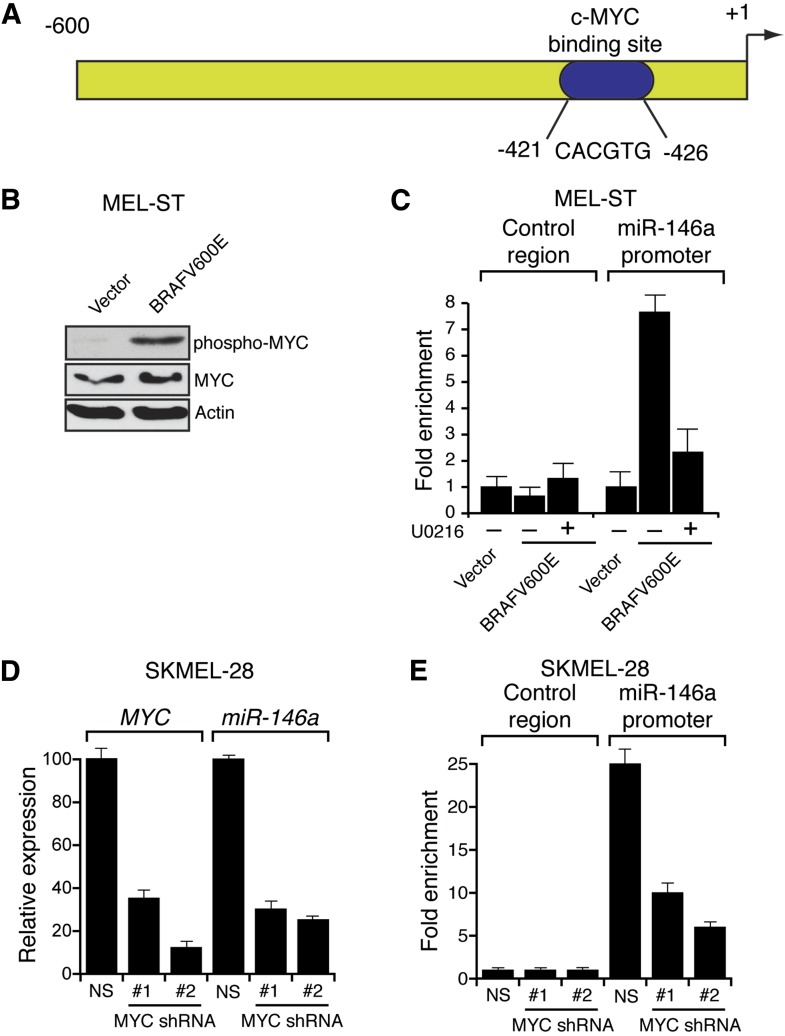
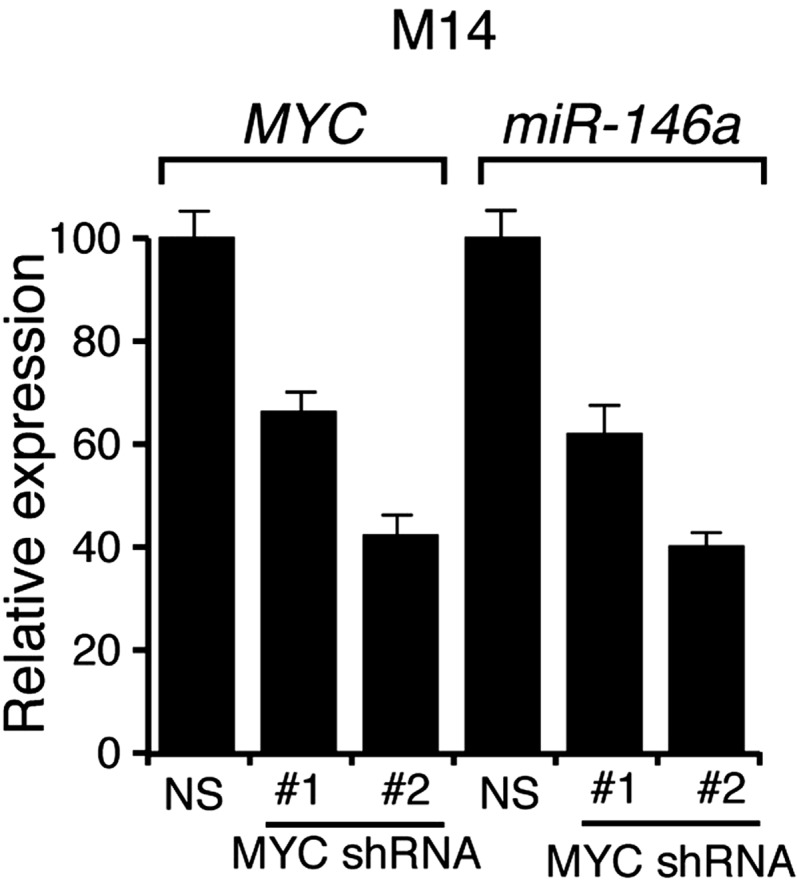
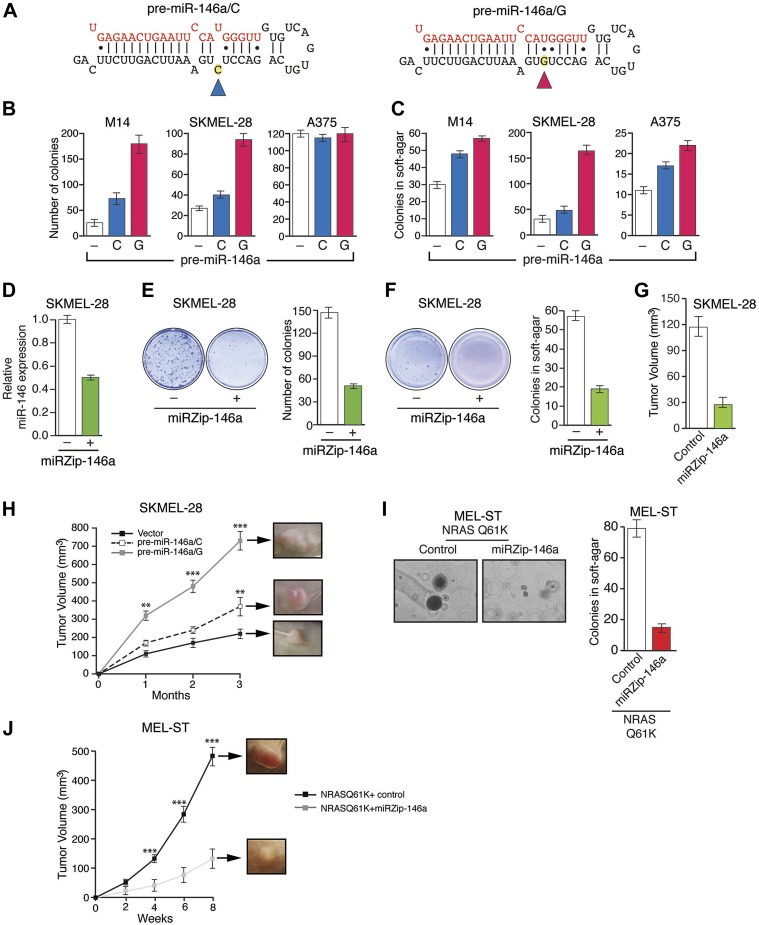
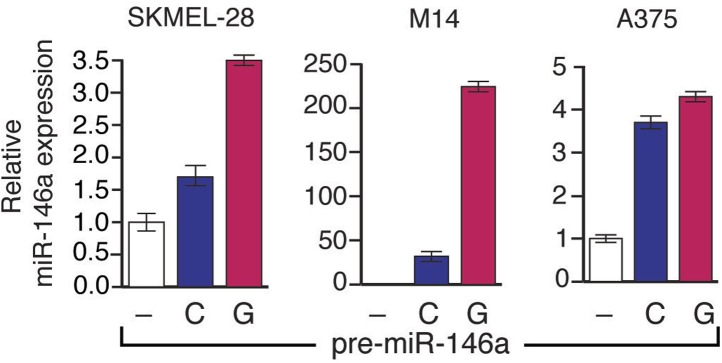
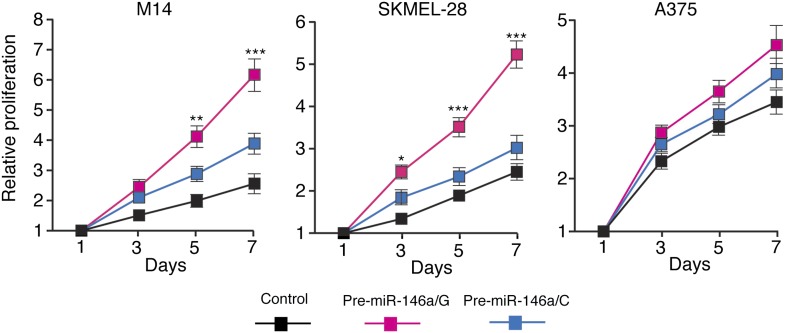
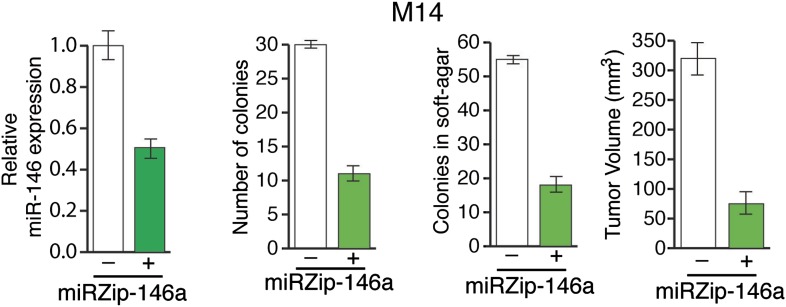
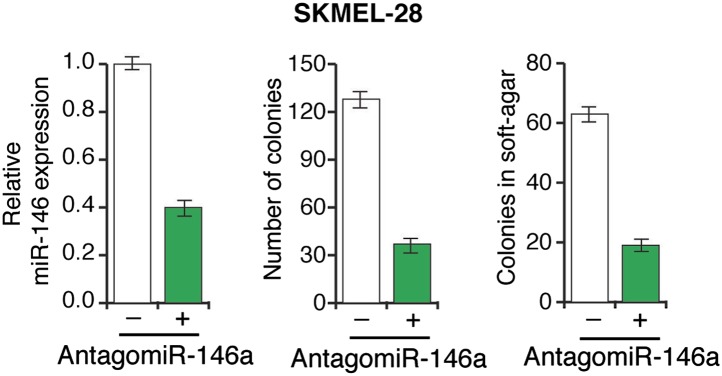
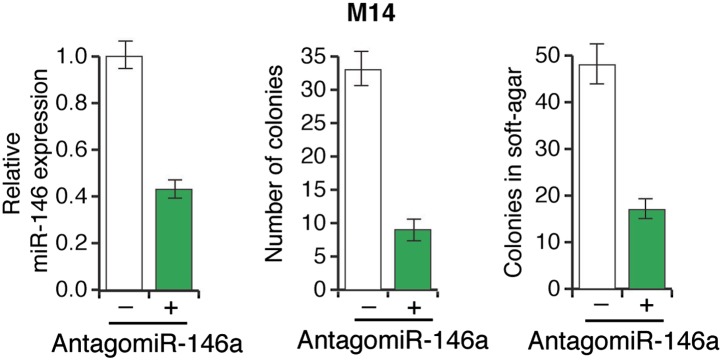
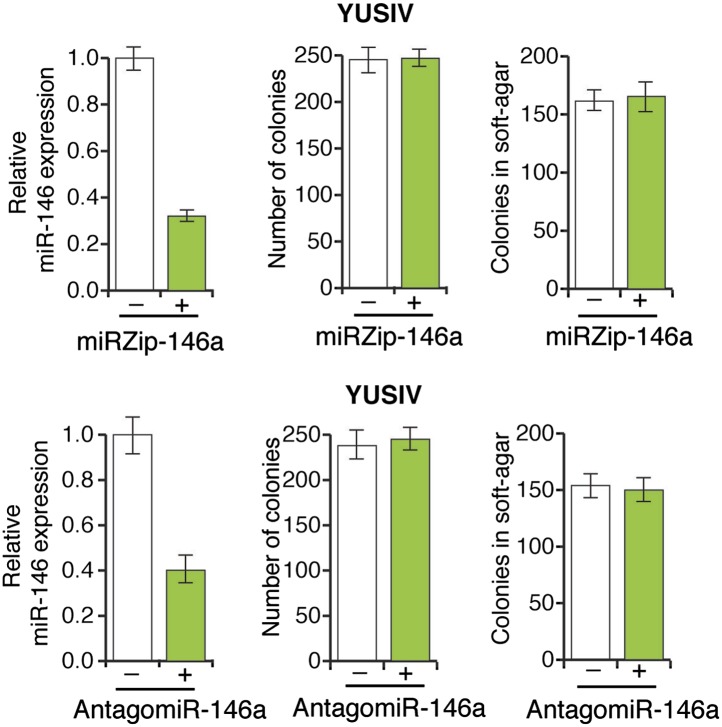
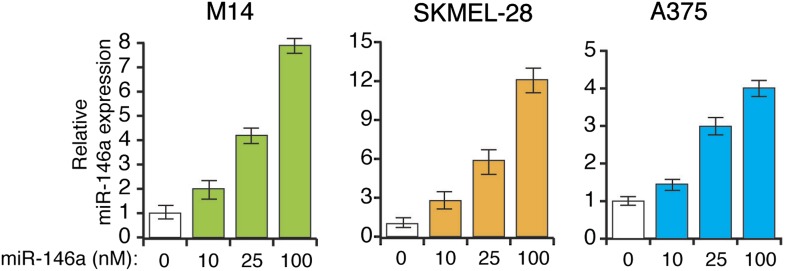
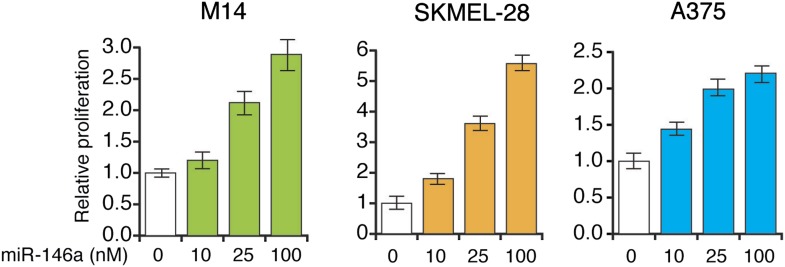
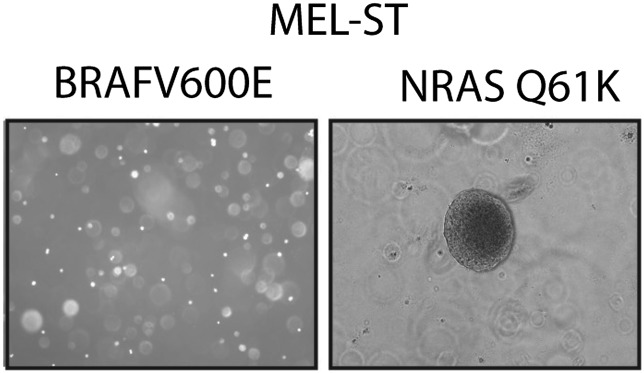
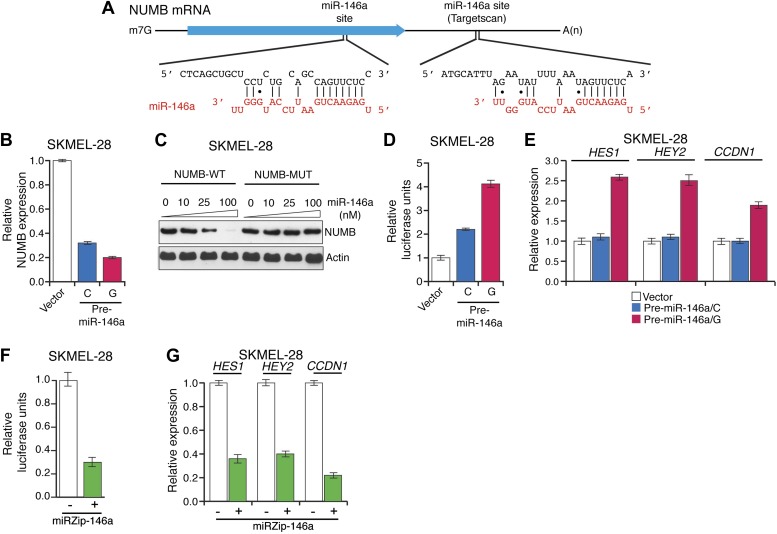
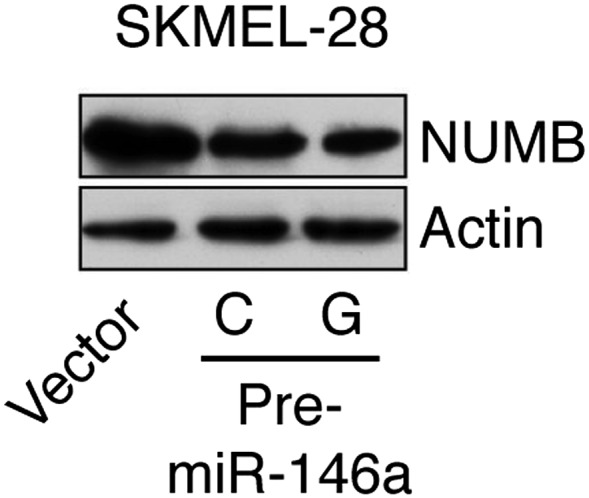
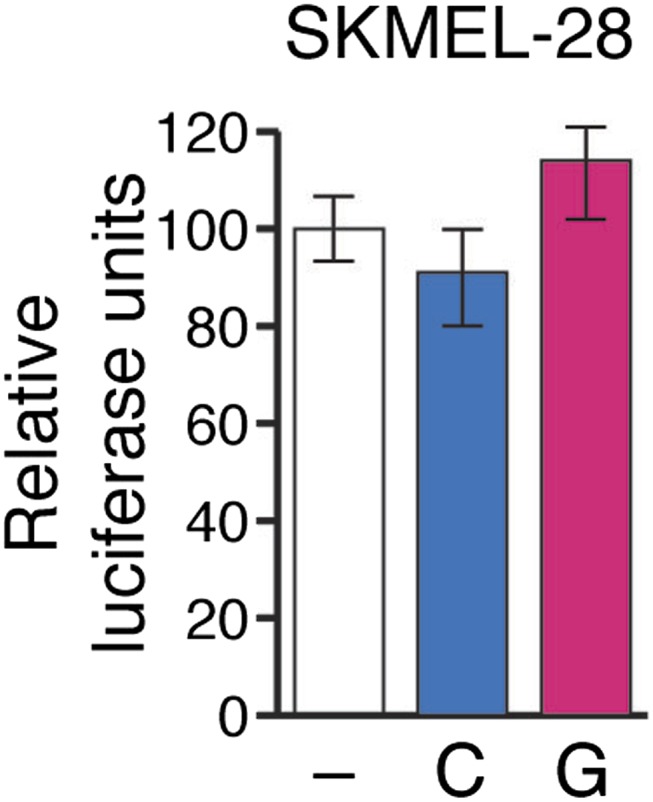
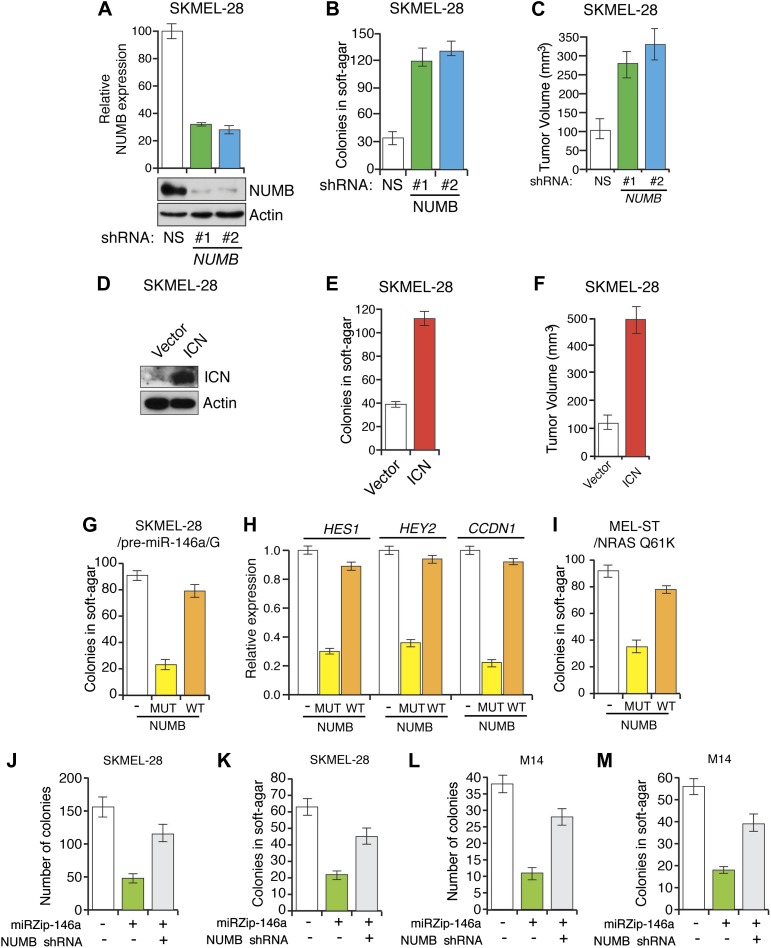
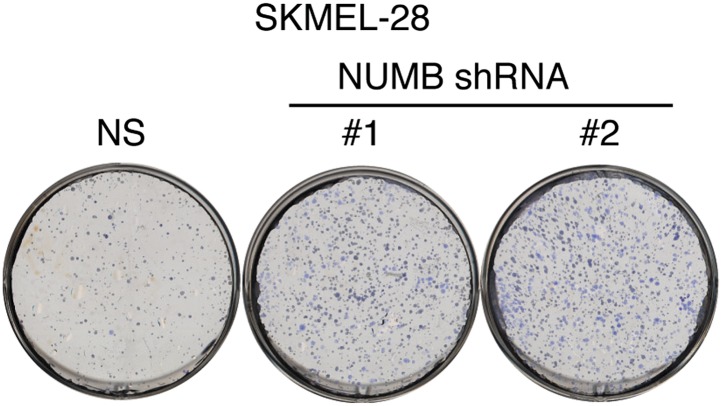
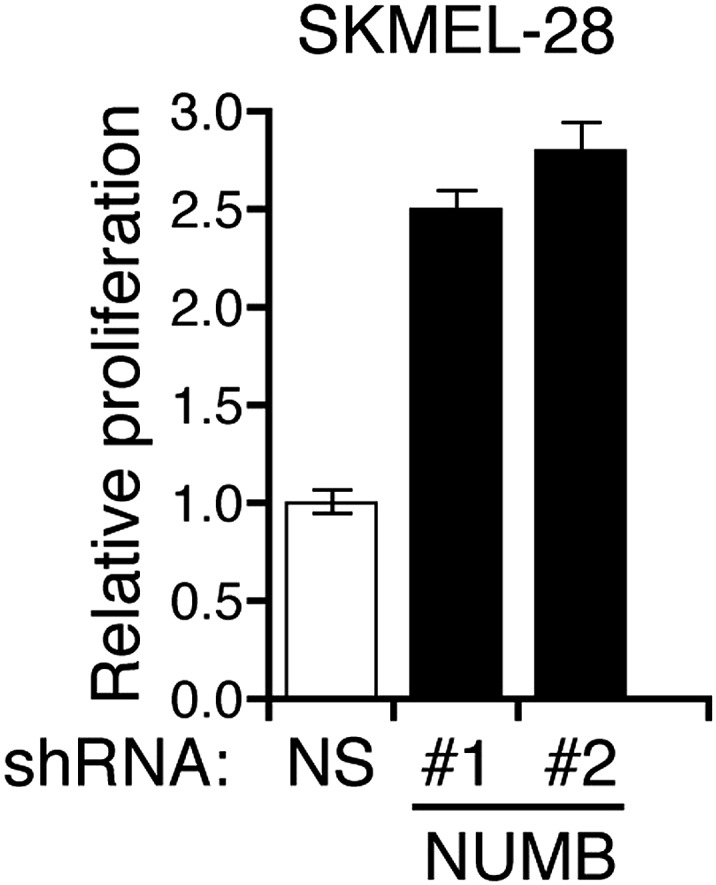
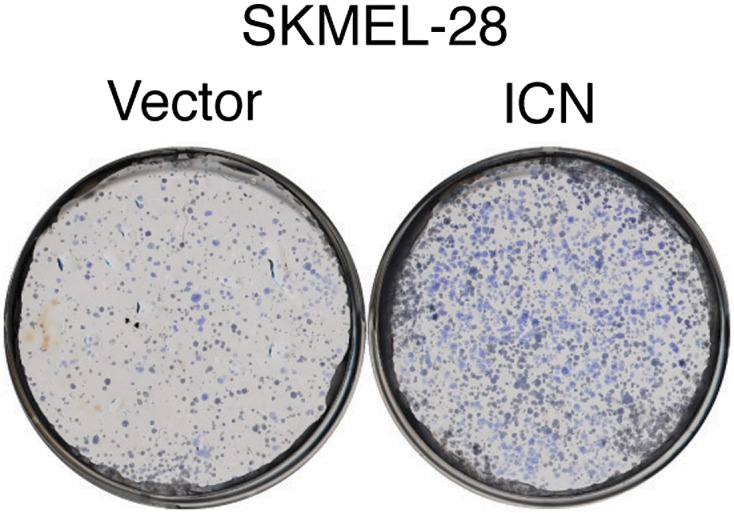
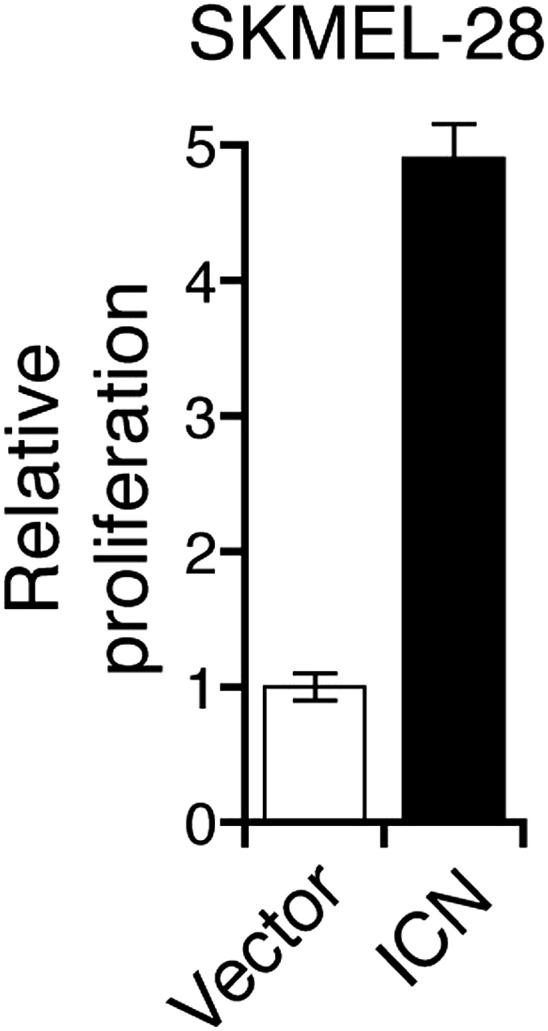
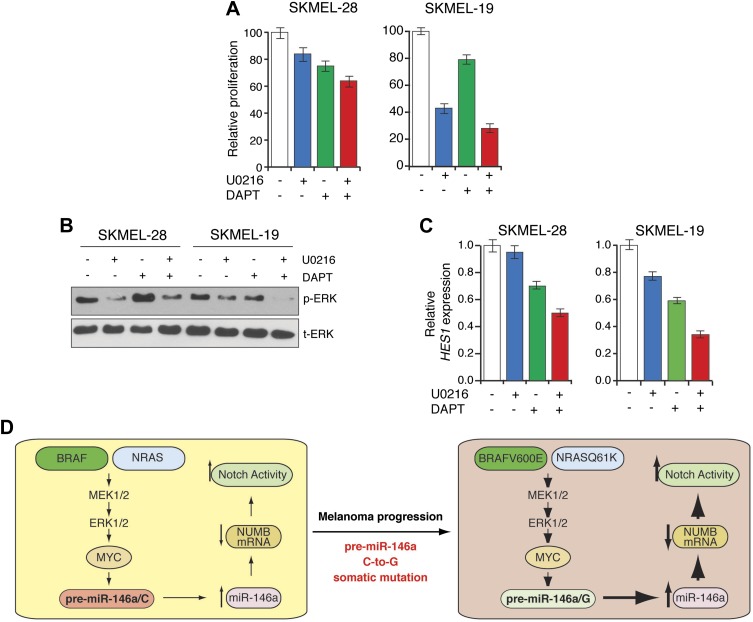
Oncogenic mutations in BRAF and NRAS occur in 70% of melanomas. In this study, we identify a microRNA, miR-146a, that is highly upregulated by oncogenic BRAF and NRAS. Expression of miR-146a increases the ability of human melanoma cells to proliferate in culture and form tumors in mice, whereas knockdown of miR-146a has the opposite effects. We show these oncogenic activities are due to miR-146a targeting the NUMB mRNA, a repressor of Notch signaling. Previous studies have shown that pre-miR-146a contains a single nucleotide polymorphism (C>G rs2910164). We find that the ability of pre-miR-146a/G to activate Notch signaling and promote oncogenesis is substantially higher than that of pre-miR-146a/C. Analysis of melanoma cell lines and matched patient samples indicates that during melanoma progression pre-miR-146a/G is enriched relative to pre-miR-146a/C, resulting from a C-to-G somatic mutation in pre-miR-146a/C. Collectively, our results reveal a central role for miR-146a in the initiation and progression of melanoma. DOI: http://dx.doi.org/10.7554/eLife.01460.001.

Keywords: BRAF; NRAS; melanoma; miRNA.


Conflict of interest statement

The authors declare that no competing interests exist.

Figures

Figure 1.
Figure 1.. BRAFV600E and NRASQ61K upregulate miR-146a expression.
(A) Schematic summary of study design. (B) Volcano plot showing miR-146a (red arrow) as the most upregulated miRNA. (C) qRT-PCR analysis of miR-146a expression in primary melanocytes transduced with BRAFV600E (gray) or Vector control (black) retrovirus particles. Quiescent cells were used as a control (light gray). (D) qRT-PCR analysis (top) measuring miR-146a expression in MEL-ST cells expressing BRAFV600E in the presence (+) or absence (−) of the MEK inhibitor U0216 (10 µM) relative to Vector control. Immunoblots (bottom) of phosphorylated (p-) ERK (upper) and total (t-) ERK (lower) show that BRAFV600E activates MEK-dependent phosphorylation of ERK. (E) qRT-PCR analysis (top) measuring miR-146a expression in MEL-ST cells expressing NRASQ61K relative to Vector control. Immunoblots (bottom) of phosphorylated (p-) ERK (upper) and total (t-) ERK (lower) show that NRASQ61K activates phosphorylation of ERK. (F) qRT-PCR analysis (top) measuring miR-146a expression in MEL-ST cells expressing constitutively active MEK (DD), relative to the Vector control. Immunoblots (bottom) of p-ERK (upper) and t-ERK (lower) show that MEK (DD) activates phosphorylation of ERK. (G) qRT-PCR analysis monitoring miR-146a expression in melanocyte and melanoma cell lines. BRAF (blue) and NRAS (orange) mutant cell lines are indicated. DOI: http://dx.doi.org/10.7554/eLife.01460.003
Figure 1—figure supplement 1.
Figure 1—figure supplement 1.. Ectopic expression of BRAFV600E in WI-38 and IMR-90 cells stimulates miR-146a expression.
qRT-PCR analysis of miR-146a expression in WI-38 or IMR-90 cells transduced with BRAFV600E (gray) or Vector control (black) retrovirus particles. Quiescent cells were used as a control (light gray). DOI: http://dx.doi.org/10.7554/eLife.01460.004
Figure 1—figure supplement 2.
Figure 1—figure supplement 2.. Activation of MAP Kinase pathway target genes upon ectopic expression of BRAFV600E in MEL-ST cells.
qRT-PCR analysis of MEK-ERK transcriptional targets FOS, EGR1 and FOSL1 under indicated conditions in MEL-ST cells expressing either an empty vector or BRAFV600E. DOI: http://dx.doi.org/10.7554/eLife.01460.005
Figure 1—figure supplement 3.
Figure 1—figure supplement 3.. Ectopic expression of HRAS v12 or HRAS v12 S35 in MEL-ST cells stimulates miR-146 expression.
qRT-PCR analysis of miR-146a (left) and immunoblot analysis (right) of phosphorylated (p-) ERK, total (t-) ERK in MEL-ST cells transduced with empty vector, HRAS v12, or HRAS v12s35. DOI: http://dx.doi.org/10.7554/eLife.01460.006
Figure 1—figure supplement 4.
Figure 1—figure supplement 4.. Inhibition of MAP kinase signaling by MEK inhibitor blocks HRAS v12-mediated miR-146a upregulation.
qRT-PCR analysis (left) to monitor miR-146a expression and immunoblot analysis (right) of phosphorylated (p-) ERK and total (t-) ERK in MEL-ST cells transduced with HRAS v12 in the presence (+) or absence (−) of the MEK inhibitor U0216. DOI: http://dx.doi.org/10.7554/eLife.01460.007
Figure 1—figure supplement 5.
Figure 1—figure supplement 5.. Ectopic expression of MEK DD stimulates the transcription of MAP kinase target genes.
qRT-PCR analysis of MEK-ERK transcriptional targets FOS, EGR1 and FOSL1 in MEL-ST cells expressing either a empty vector or constitutively active MEK (MEK DD). DOI: http://dx.doi.org/10.7554/eLife.01460.008
Figure 2.
Figure 2.. BRAFV600E upregulates miR-146a through MYC oncogene.
(A) Schematic representation of MYC promoter and the miR-146a binding site that has been identified by PROMO analysis software. ‘+1’ indicates the transcription start site. (B) Immunoblot analysis of p-MYC and total MYC in whole cell lysates of MEL-ST cells transduced with empty vector or BRAFV600E. Actin was used as a loading control. (C) Chromatin immunoprecipitation (ChIP) assay measuring MYC binding to the miR-146a promoter in MEL-ST cells stably expressing BRAFV600E in the presence (+) or absence (−) of the MEK inhibitor U0216 relative to cells transduced with the empty vector. A non-specific control region served as a negative control for MYC recruitment. (D) qRT-PCR analysis of MYC mRNA (left) and miR-146a (right) expression in SKMEL-28 cells infected with MYC shRNAs. (E) qPCR analysis of MYC ChIP of miR-146a promoter and negative control in SKMEL-28 cells infected with MYC shRNAs. DOI: http://dx.doi.org/10.7554/eLife.01460.009
Figure 2—figure supplement 1.
Figure 2—figure supplement 1.. Analysis of MYC and miR-146a expression in M14 cells expressing shRNAs against MYC.
qRT-PCR analysis of MYC and miR-146a expression in M14 cells transduced with MYC shRNA expression vectors relative to cells transduced with a non-specific (NS) shRNA vector. DOI: http://dx.doi.org/10.7554/eLife.01460.010
Figure 2—figure supplement 2.
Figure 2—figure supplement 2.. shRNA-mediated downrgulation of MYC in M14 cells inhibits the expression of MYC transcriptional target genes.
qRT-PCR analysis of MYC targets CCDN1 and CDC25C in M14 cells transduced with MYC shRNA expression vectors relative to cells transduced with a non-specific (NS) shRNA vector. DOI: http://dx.doi.org/10.7554/eLife.01460.011
Figure 2—figure supplement 3.
Figure 2—figure supplement 3.. shRNA-mediated downrgulation of MYC in SKMEL-28 cells inhibits the expression of MYC transcriptional target genes.
qRT-PCR analysis of MYC targets CCDN1 and CDC25C in SKMEL-28 cells transduced with MYC shRNA expression vectors relative to cells transduced with a non-specific (NS) shRNA vector. DOI: http://dx.doi.org/10.7554/eLife.01460.012
Figure 2—figure supplement 4.
Figure 2—figure supplement 4.. Transcriptional regulation of miR-146a.
qRT-PCR analysis of ETS1, ELK1, NF-κB, c/EBPβ and miR-146a in SKMEL-28 expressing indicated shRNA. DOI: http://dx.doi.org/10.7554/eLife.01460.013
Figure 3.
Figure 3.. Oncogenic activity of pre-miR-146a/C and pre-miR-146a/G.
(A) Schematic representation of pre-miR-146a/C and pre-miR-146a/G sequences. (B and C) Number of colonies formed in liquid (B) or soft-agar (C) by M14, SKMEL-28 or A375 melanoma cells expressing pre-miR-146a harboring a C or G at position 40, as compared to the Vector (−) control. Colonies were counted after 2 weeks (B) or 4 weeks (C) of growth. (D) qRT-PCR analysis of miR-146a expression in SKMEL-28 cells infected with miRZip-146a (+) or an empty vector (−). (E and F) Number of colonies formed in liquid (E) or soft-agar (F) by SKMEL-28 expressing miRZip-146a (+) or the vector (−) control. Colonies were counted after 2 weeks (E) or 4 weeks (F) of growth. (G) Average tumor volumes at 1 month time points for mice injected with SKMEL-28 expressing a control miRZip or miRZip-146a. (H) Average volume of tumors formed by SKMEL-28 cells (2.5 × 10⁶) expressing pre-miR-146a/C or pre-miR-146a/G, as compared to the Vector control, injected subcutaneously into the flanks of nude mice (n = 5). (I) Representative images (left) and colony number in soft-agar (right) for the NRASQ61K transformed MEL-ST cells that express an empty vector or miRZip-146a. (J) Average tumor volumes at the indicated time points for mice injected with NRASQ61K transformed MEL-ST cells expressing a control miRZip or miRZip-146a. DOI: http://dx.doi.org/10.7554/eLife.01460.014
Figure 3—figure supplement 1.
Figure 3—figure supplement 1.. Analysis of miR-146a expression in SKMEL-28, A375 and M14 cells expressing either pre-miR-146a/G or pre-miR-146a/C construct.
SKMEL-28, M14 and A375 cells stably expressing pre-miR-146a/C (C) or pre-miR-146a/G (G) or an empty vector (−) were analyzed for miR-146a expression by qRT-PCR. DOI: http://dx.doi.org/10.7554/eLife.01460.015
Figure 3—figure supplement 2.
Figure 3—figure supplement 2.. pre-miR-146a/G promotes proliferation of melanoma cells more effective than pre-miR-146a/C.
M14, SKMEL-28 and A375 cells stably expressing pre-miR-146a/C (blue) or pre-miR-146a/G (red) or an empty vector (black) were analyzed for proliferation at indicated days. Relative proliferation is plotted. *, ** and *** represents p values <0.01, <0.001 and <0.0001 respectively. DOI: http://dx.doi.org/10.7554/eLife.01460.016
Figure 3—figure supplement 3.
Figure 3—figure supplement 3.. Inhibition of miR-146a expression blocks the proliferation and anchorage-independent growth of M14 cells.
M14 cells either expressing a control miRZip vector or miRZip-146a were analyzed for miR-146a expression, colony formation, or growth in soft-agar or tumor formation in mice. Tumor volume at 1 month timepoint is plotted. DOI: http://dx.doi.org/10.7554/eLife.01460.017
Figure 3—figure supplement 4.
Figure 3—figure supplement 4.. Inhibition of miR-146a expression blocks the proliferation and anchorage-independent growth of SKMEL-28 cells.
SKMEL-28 cells either expressing a scrambled LNA-antagomiR or LNA-based miR146a antagomiR were analyzed for miR-146a expression (left), colony formation (middle) or growth in soft-agar (right). DOI: http://dx.doi.org/10.7554/eLife.01460.018
Figure 3—figure supplement 5.
Figure 3—figure supplement 5.. Inhibition of miR-146a expression blocks the proliferation and anchorage-independent growth of M14 cells.
M14 cells either expressing a scrambled LNA-antagomiR or LNA-based miR146a antagomiR were analyzed for miR-146a expression (left), colony formation (middle) or growth in soft-agar (right). DOI: http://dx.doi.org/10.7554/eLife.01460.019
Figure 3—figure supplement 6.
Figure 3—figure supplement 6.. Inhibition of miR-146a expression does not block the proliferation and anchorage-independent growth of YUSIV cells.
(Top panel) YUSIV cells either expressing a control miR-ZIP vector or miR-Zip-miR146a were analyzed for miR-146a expression (left), colony formation (middle) or growth in soft-agar (right). (Bottom Panel) YUSIV cells either expressing a control LNA-based control antagomiR or LNA-based miR-146a antagomiR were analyzed for miR-146a expression (left), colony formation (middle) or growth in soft-agar (right). DOI: http://dx.doi.org/10.7554/eLife.01460.020
Figure 3—figure supplement 7.
Figure 3—figure supplement 7.. Analysis of miR-146a expression in indicated melanoma cell lines transfected with increasing concentration of synthetic miR-146a.
qRT-PCR analysis of miR-146a expression in indicated melanoma cell lines. DOI: http://dx.doi.org/10.7554/eLife.01460.021
Figure 3—figure supplement 8.
Figure 3—figure supplement 8.. miR-146a enhances the growth of melanoma cell lines in a concentration dependent manner.
Relative proliferation of indicated melanoma cell lines 5 days after the transfection of synthetic mature miR-146a at indicated concentrations. DOI: http://dx.doi.org/10.7554/eLife.01460.022
Figure 3—figure supplement 9.
Figure 3—figure supplement 9.. NRASQ61K is sufficient to transform MEL-ST cells.
Representative images of soft-agar colonies formed by MEL-ST cells expressing BRAFV600E. NRASQ61K was used as a positive control. DOI: http://dx.doi.org/10.7554/eLife.01460.023
Figure 4.
Figure 4.. Downregulation of NUMB and activation of NOTCH signaling by pre-miR-146a/C and pre-miR-146a/G.
(A) Schematic representation of the NUMB mRNA and potential miR-146a target sites in the coding region (blue arrow) and 3′-UTR. (B) qRT-PCR analysis of NUMB mRNA levels in SKMEL-28 cells expressing the indicated pre-miR-146a allele relative to the Vector control. (C) Western blot of NUMB expression in SKMEL-28 cells transfected with either wild-type NUMB (NUMB-WT) or miR-146a-resistant NUMB (NUMB-MUT) and increasing amount of synthetic miR-146a. (D) Dual luciferase assay using a CSL-Luciferase reporter to measure NOTCH activity in SKMEL-28 cells expressing the indicated pre-miR-146a alleles relative to the Vector control. (E) qRT-PCR analysis of the NOTCH targets HES1, HEY2 and CCDN1 mRNA in indicated samples. Actin mRNA was used as an internal control. (F) Dual luciferase assay using a CSL-Luciferase reporter to measure NOTCH activity in SKMEL-28 cells expressing miRZip-146a relative to the Vector control. (G) qRT-PCR analysis of HES1, HEY2 and CCDN1 mRNA in indicated samples. Actin mRNA was used as a loading control. DOI: http://dx.doi.org/10.7554/eLife.01460.024
Figure 4—figure supplement 1.
Figure 4—figure supplement 1.. Ectopic expression of miR-146a downregulates NUMB protein expression.
Immunoblot analysis of NUMB protein in SKMEL-28 cells stably transduced with empty vector, pre-miR-146a/C or pre-miR-146a/G. DOI: http://dx.doi.org/10.7554/eLife.01460.025
Figure 4—figure supplement 2.
Figure 4—figure supplement 2.. Relative luciferase activity of NUMB 3′UTR luciferase construct in SKMEL-28 cells expressing an empty vector (−), pre-miR-146a/C (C) or pre-miR-146a/G (G).
DOI: http://dx.doi.org/10.7554/eLife.01460.026
Figure 5.
Figure 5.. miR-146 oncogenic activity depends on the activation of the NOTCH signaling through downregulation of the tumor suppressor NUMB.
(A) qRT-PCR analysis (top) and immunoblot (bottom) of NUMB expression levels in SKMEL-28 cells infected with two different shRNAs against NUMB relative to the control non-silencing shRNA (NS). (B) Number of colonies in soft-agar of SKMEL-28 cells expressing NUMB shRNAs relative to the control non-silencing shRNA (NS). (C) Average volume of tumors formed by SKMEL-28 cells (2.5 × 10⁶) expressing NUMB shRNAs, relative to the non-silencing shRNA (NS shRNA) control, injected subcutaneously into the flanks of nude mice (n = 5). (D and E) Immunoblot of NOTCH (D) and colony formation assay (E) of SKMEL-28 cells stably transduced with the activated intracellular NOTCH domain (ICN) or empty vector. (F) Average volume of tumors formed by SKMEL-28 cells expressing the activated intracellular NOTCH domain (ICN) relative to vector control. 2.5 × 10⁶ cells were injected subcutaneously into the flank of nude mice (n = 5). (G) Colony formation in soft-agar of SKMEL-28 cells expressing pre-miR-146a/G and transfected with either an empty vector, NUMB wild-type (WT) or an miR-146a-resistant NUMB (MUT). (H) qRT-PCR analysis of HES1, HEY2 and CCDN1 mRNA in indicated samples. Actin was used as an internal control. (I) Colony formation in soft-agar of MEL-ST/NRASQ61K transfected with either an empty vector, NUMB wild-type (WT) or miR-146a-resistant NUMB (MUT). (J and K) Number of colonies formed in liquid (J) or soft-agar (K) by SKMEL-28 expressing miRZip-146a (+) or the control miRZip (−) that either express a non-silencing shRNA or an shRNA against NUMB. Colonies were counted after 2 weeks (J) or 4 weeks (K) of growth. (L and M) Number of colonies formed in liquid (L) or soft-agar (M) by M14 expressing miRZip-146a (+) or the control miRZip (−) that either express a non-silencing shRNA or an shRNA against NUMB. Colonies were counted after 2 weeks (L) or 4 weeks (M) of growth. DOI: http://dx.doi.org/10.7554/eLife.01460.027
Figure 5—figure supplement 1.
Figure 5—figure supplement 1.. Inhibition of NUMB expression promotes growth of SKMEL-28 cells.
Colony formation assay of SKMEL-28 cells expressing two different NUMB shRNAs relative to a non-silencing (NS) shRNA. DOI: http://dx.doi.org/10.7554/eLife.01460.028
Figure 5—figure supplement 2.
Figure 5—figure supplement 2.. Inhibition of NUMB promotes proliferation of melanoma cells.
Proliferation assay of SKMEL-28 cells expressing two different NUMB shRNAs relative to a non-silencing (NS) shRNA. DOI: http://dx.doi.org/10.7554/eLife.01460.029
Figure 5—figure supplement 3.
Figure 5—figure supplement 3.. Ectopic expression of activated Notch promotes the growth of melanoma cells.
Colony formation assay of SKMEL-28 cells stably transduced with the activated intracellular NOTCH domain (ICN) or empty vector. DOI: http://dx.doi.org/10.7554/eLife.01460.030
Figure 5—figure supplement 4.
Figure 5—figure supplement 4.. Ectopic expression of intracellular Notch promotes proliferation of melanoma cells.
Proliferation rate of SKMEL-28 cells stably expressing Intracellular NOTCH (ICN) relative to cells with empty vector. Proliferation rate was measured after 72 hr of growth using a colorimetric MTT assay. DOI: http://dx.doi.org/10.7554/eLife.01460.031
Figure 6.
Figure 6.. Synergistic melanoma growth inhibition by simultaneous blockage of Notch and BRAF signaling.
(A) MTT proliferation assay. (B) Immunoblot analysis of phosphorylated (p-) ERK and total (t-) ERK and (C) qRT-PCR analysis of NOTCH target HES1 in SKMEL-28 and SKMEL-19 cells left untreated or treated with U0216, DAPT or combination of both drugs. (D) Model. DOI: http://dx.doi.org/10.7554/eLife.01460.032

References

    1. Ambros V, Lee RC, Lavanway A, Williams PT, Jewell D. 2003. MicroRNAs and other tiny endogenous RNAs in C. elegans. Current Biology 13:807–818. 10.1016/S0960-9822(03)00287-2 - DOI - PubMed
    1. Asnaghi L, Ebrahimi KB, Schreck KC, Bar EE, Coonfield ML, Bell WR, Handa J, Merbs SL, Harbour JW, Eberhart CG. 2012. Notch signaling promotes growth and invasion in uveal melanoma. Clinical Cancer Research 18:654–665. 10.1158/1078-0432.CCR-11-1406 - DOI - PMC - PubMed
    1. Aubin-Houzelstein G, Djian-Zaouche J, Bernex F, Gadin S, Delmas V, Larue L, Panthier JJ. 2008. Melanoblasts’ proper location and timed differentiation depend on Notch/RBP-J signaling in postnatal hair follicles. The Journal of Investigative Dermatology 128:2686–2695. 10.1038/jid.2008.120 - DOI - PubMed
    1. Balint K, Xiao M, Pinnix CC, Soma A, Veres I, Juhasz I, Brown EJ, Capobianco AJ, Herlyn M, Liu ZJ. 2005. Activation of Notch1 signaling is required for beta-catenin-mediated human primary melanoma progression. The Journal of Clinical Investigation 115:3166–3176. 10.1172/JCI25001 - DOI - PMC - PubMed
    1. Bartel DP. 2004. MicroRNAs: genomics, biogenesis, mechanism, and function. Cell 116:281–297. 10.1016/S0092-8674(04)00045-5 - DOI - PubMed

Publication types

MeSH terms