

Stress-induced OMA1 activation and autocatalytic turnover regulate OPA1-dependent mitochondrial dynamics
- PMID: 24550258
- PMCID: PMC3989652
- DOI: 10.1002/embj.201386474
Stress-induced OMA1 activation and autocatalytic turnover regulate OPA1-dependent mitochondrial dynamics
Abstract
The dynamic network of mitochondria fragments under stress allowing the segregation of damaged mitochondria and, in case of persistent damage, their selective removal by mitophagy. Mitochondrial fragmentation upon depolarisation of mitochondria is brought about by the degradation of central components of the mitochondrial fusion machinery. The OMA1 peptidase mediates the degradation of long isoforms of the dynamin-like GTPase OPA1 in the inner membrane. Here, we demonstrate that OMA1-mediated degradation of OPA1 is a general cellular stress response. OMA1 is constitutively active but displays strongly enhanced activity in response to various stress insults. We identify an amino terminal stress-sensor domain of OMA1, which is only present in homologues of higher eukaryotes and which modulates OMA1 proteolysis and activation. OMA1 activation is associated with its autocatalyic degradation, which initiates from both termini of OMA1 and results in complete OMA1 turnover. Autocatalytic proteolysis of OMA1 ensures the reversibility of the response and allows OPA1-mediated mitochondrial fusion to resume upon alleviation of stress. This differentiated stress response maintains the functional integrity of mitochondria and contributes to cell survival.
Figures

Linear depiction of the OPA1 splice variants 1 and 7. L-OPA1 splice variant 1 (b) and splice variant 7 (a) are shown with cleavage sites for OMA1 (S1) or YME1L (S2). Processing generates S-OPA1 form e (OMA1) or S-OPA1 forms c (OMA1) and d (YME1L). MTS, mitochondrial targeting sequence; TM, transmembrane domain.
OMA1 is required for inducible and constitutive OPA1 processing. Oma1+/+ and Oma1−/− MEFs expressing OMA1-myc or OMA1E324Q-myc as indicated were incubated in the absence or presence of CCCP for 2 h.
Stress-induced OPA1 processing by OMA1. Oma1+/+ and Oma1−/− MEFs were incubated with CCCP, valinomycin, oligomycin (Oligo) and/or antimycin A (Anti) for 1 h.
Determination of ΔΨ in Oma1+/+ MEFs under various stress conditions by JC-1 staining. Untreated MEFs were used as a control.
Heat stress-induced OPA1 processing depends on OMA1. Oma1+/+ and Oma1−/− MEFs were cultured at 42°C for the times indicated.
H2O2 induces OMA1-mediated OPA1 processing. Oma1+/+ and Oma1−/− MEFs were incubated in the presence of H2O2 (0.5 mM) for the times indicated. In all panels, cellular proteins were extracted and analysed by SDS–PAGE and immunoblotting. a-e, OPA1 forms.

Submitochondrial localisation of OMA1. Mitochondria and mitoplasts, which were generated by hypotonic disruption of the OM (swelling), were incubated with or without proteinase K (PK; 50 μg/ml) and analysed by SDS–PAGE and immunoblotting. The IMS protein Smac and the matrix protein Hsp60 served as controls. Mitochondrial membranes were solubilised with Triton X-100 where indicated. The slightly reduced level of Smac upon PK treatment of mitochondria indicates partial disruption of the OM upon purification of mitochondria.
OMA1 is an integral membrane protein. Alkaline extracts of mitochondria in Na2CO3 (pH 11.5) were separated into soluble (S) and membrane (P) fractions by centrifugation and analysed by SDS–PAGE and immunoblotting. The integral inner membrane protein PHB2 and the soluble intermembrane space protein Smac served as controls. T, total.
Topological model of mature OMA1 in the IM. The C-terminal M48 metallopeptidase domain is exposed to the IMS, whereas the N-terminal domain is present at the matrix side of the IM.
FLAG-tagged OPA1 Sp1 or OPA1 Sp1-TCS, which contains a TEV-cleavage site (TCS) instead of S1, were transfected into cell lines allowing tetracycline-inducible expression of HA-tagged Su9-TEV (targeted to the matrix) or Smac-TEV (targeted to the IMS). Cells were treated with tetracycline when indicated and analysed by SDS–PAGE and immunoblotting.
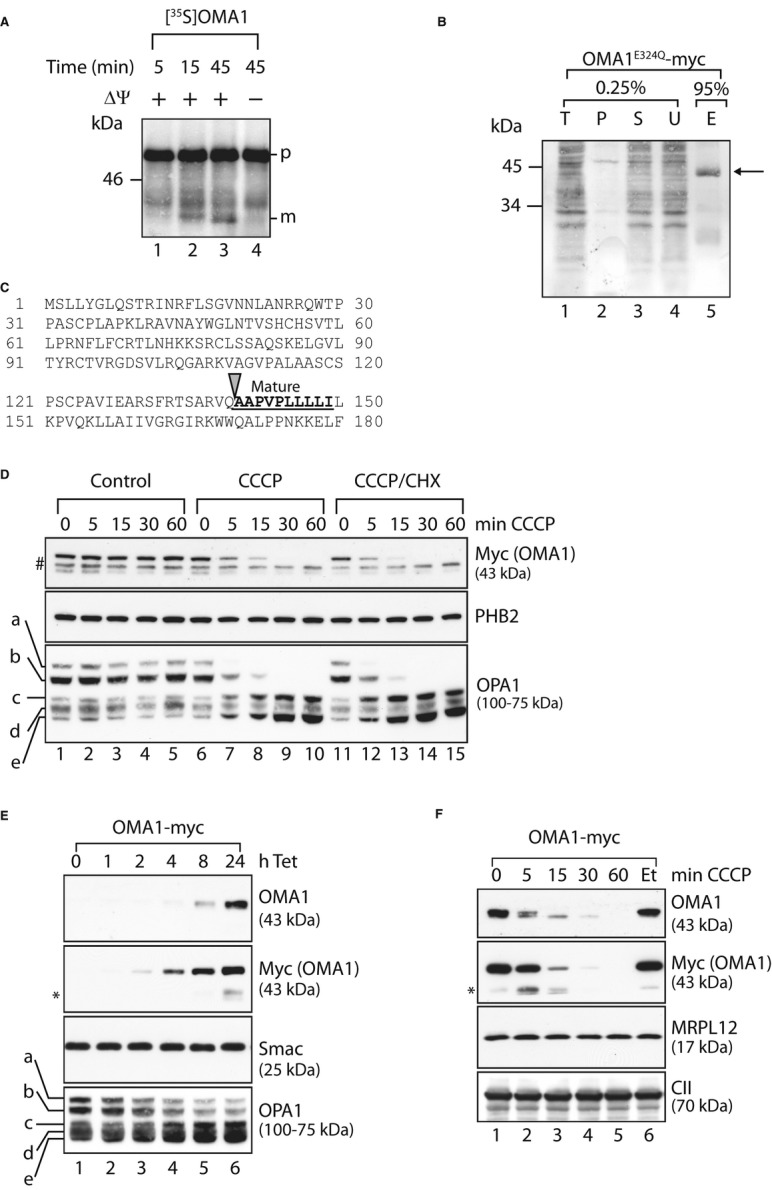
In vitro import of OMA1 into mitochondria. Mitochondria were isolated from MEFs and incubated with [35S]-labelled OMA1 that was synthesised in a cell-free system for the time points indicated in the presence or absence of membrane potential (ΔΨ). Mitochondrial proteins were analysed by SDS–PAGE and autoradiography. p, precursor form; m, mature form.
N-terminal sequencing of mature OMA1. Mitochondria isolated from HEK293 cells expressing OMA1E324Q-myc were solubilised in 1% (v/v) NP-40 and subjected to immunoprecipitation using myc-specific antibodies. Total (T), pellet (P), supernatant (S) and unbound (U) fractions (0.25%) and the eluate (E; 95%) were analysed by SDS–PAGE and Coomassie staining. The arrow indicates OMA1E324Q-myc in the eluate.
N-terminal amino acid sequence of OMA1. Mature OMA1 is generated upon proteolytic cleavage at the site indicated with an arrow. The bold, underlined sequence represents the N-terminal sequence of mature OMA1 determined by Edman degradation.
Degradation of pre-existing OMA1 following mitochondrial stress. MEFs stably expressing OMA1-myc were treated with CCCP, with cyclohexamide (CHX) or with ethanol and DMSO (control) as indicated. Samples were isolated and analysed via SDS–PAGE and immunoblotting. #, non-specific cross reaction; a-e, OPA1 forms.
Overexpression of OMA1-myc in HEK293 cells. OMA1-myc expression was induced by addition of tetracycline (Tet) for the time points shown. Cell extracts were analysed by SDS–PAGE and immunoblotting. *, proteolytic fragments of OMA1.
Overexpressed OMA1 is degraded following mitochondrial dysfunction. After tetracycline-induced expression of OMA1-myc, HEK293 cells were treated with CCCP or, for control, ethanol (Et) as indicated. Samples were assessed by SDS–PAGE and immunoblotting. *, C-terminal, proteolytic fragments of OMA1.
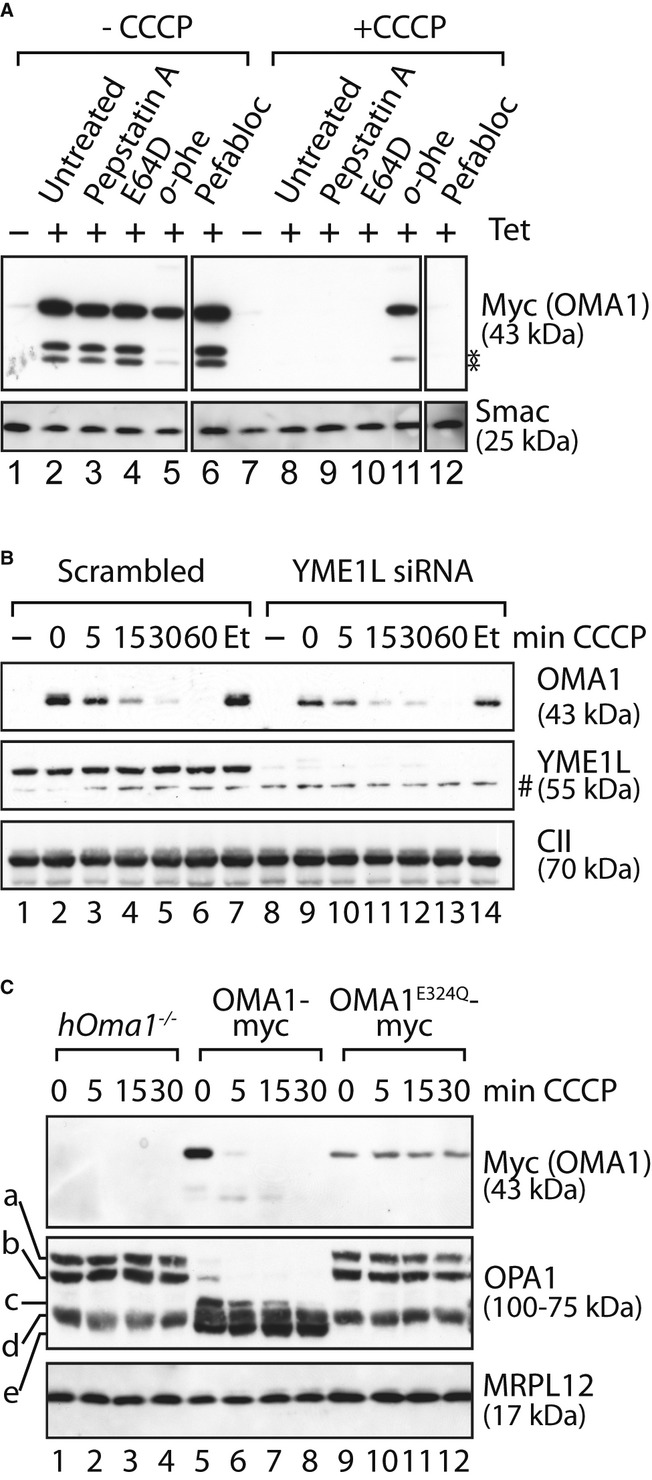
Stability of OMA1-myc in the presence of various protease inhibitors. OMA1-myc expression was induced in HEK293 cells expressing OMA1-myc. Cells were incubated for 5 h with pepstatin A, E64D, o-phenanthroline (o-phe) or pefabloc before addition of CCCP or ethanol (-CCCP) for 1 h. *, proteolytic fragments of OMA1.
Stress-induced OMA1 turnover does not depend on YME1L. HEK293 cells expressing OMA1-myc were transfected with YME1L-specific or scrambled siRNA control for 72 h and subsequently incubated in the presence of CCCP or, for control, ethanol (Et) for the time points indicated. #, non-specific cross reaction.
OMA1E324Q-myc is stable following stress. hOma1−/− cells expressing OMA1-myc or OMAE324Q-myc were incubated in the presence of CCCP as indicated. In all panels, samples were analysed by SDS–PAGE and immunoblotting using the indicated antibodies.
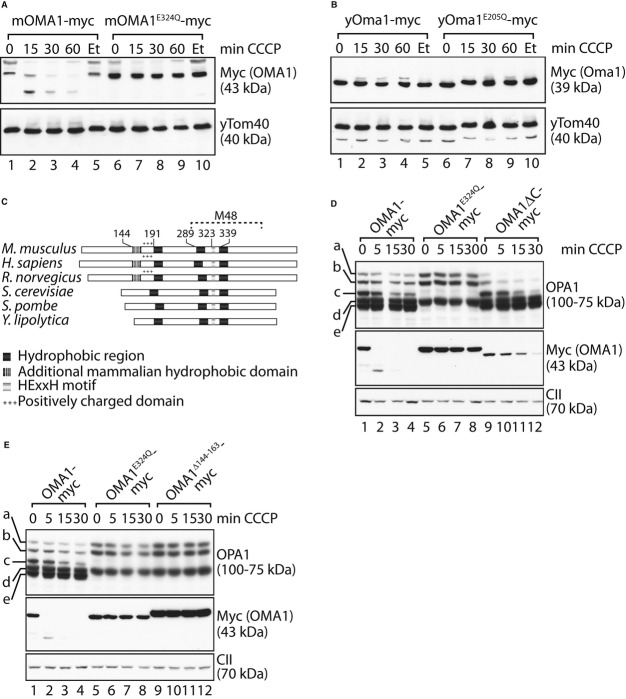
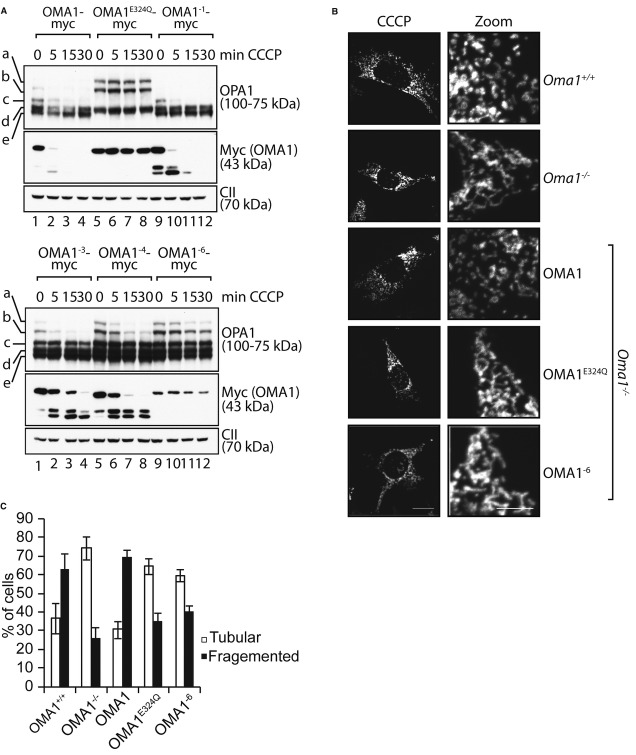
Myc-tagged OMA1 variants harbouring point mutations within the N-terminal cluster of positively charged amino acids (OMA1−1, OMA1−3, OMA1−4, OMA1−6) were stably expressed in hOma1−/− cells by addition of tetracycline. Cells were treated with CCCP for the times indicated, and cell extracts were analysed by SDS–PAGE and immunoblotting using the indicated antibodies.
The mitochondrial morphology of Oma1−/− MEFs expressing Oma1E324Q-myc or Oma1−6-myc was visualised by immunofluorescence microscopy upon co-expression of a GFP-variant targeted to the mitochondrial matrix. Cells were either treated with ethanol (not shown) or with 20 μM CCCP for 2 h as indicated.
Quantification of mitochondrial morphology in Oma1−/− MEFs expressing Oma1−6. Approximately 150 cells were scored in three independent experiments.
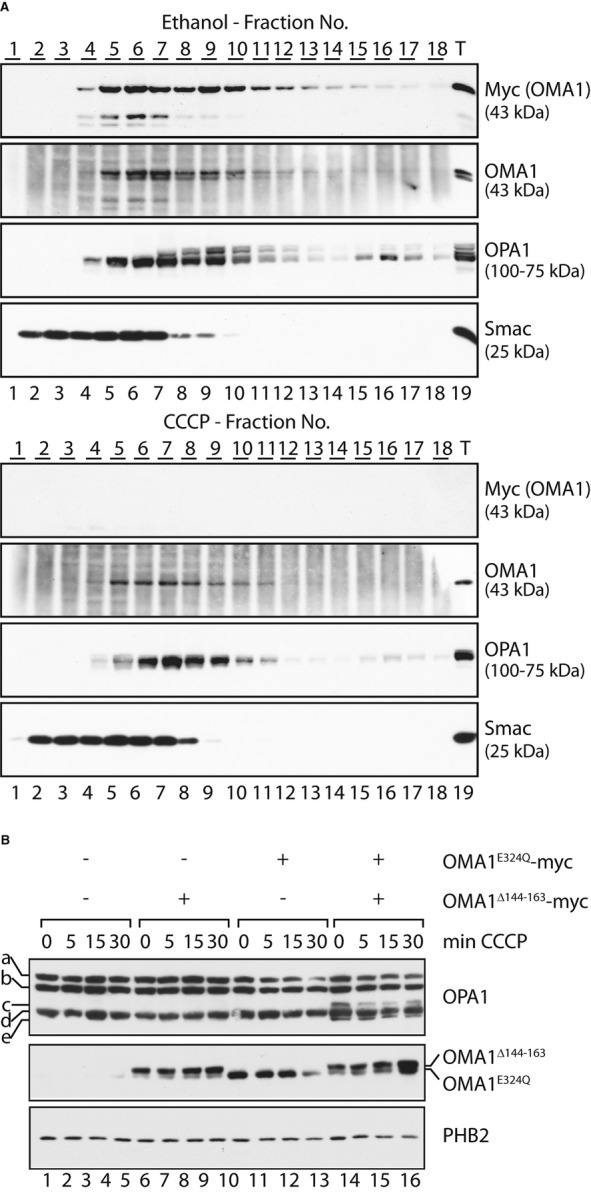
ΔΨ-independent oligomerisation of OMA1. HEK293 cells expressing OMA1-myc were incubated for 15 min in the presence of CCCP or ethanol (control) for 15 min. Isolated mitochondria were solubilised and subjected to density gradient centrifugation. Fractions were collected, TCA-precipitated and subjected to SDS–PAGE and immunoblotting.
Reconstitution of OMA1 activity upon oligomerisation of proteolytically inactive OMA1 variants. hOma1−/− cells allowing the tetracycline-inducible expression of OMA1E324Q-myc were transfected with YME1L-specific siRNA and with a plasmid encoding OMA1Δ144–163-myc. OMA1E324Q-myc expression was induced by addition of tetracycline where indicated. OPA1 processing was induced upon mitochondrial depolarisation using CCCP for the time points indicated. Cell extracts were analysed by SDS–PAGE and immunoblotting. a-e, OPA1 forms.
References
-
- Anand R, Langer T, Baker MJ. Proteolytic control of mitochondrial function and morphogenesis. Biochim Biophys Acta. 2013;1833:195–204. - PubMed
-
- Baricault L, Segui B, Guegand L, Olichon A, Valette A, Larminat F, Lenaers G. OPA1 cleavage depends on decreased mitochondrial ATP level and bivalent metals. Exp Cell Res. 2007;313:3800–3808. - PubMed
-
- Chan DC. Fusion and fission: interlinked processes critical for mitochondrial health. Annu Rev Genet. 2012;46:265–287. - PubMed
-
- Chen H, Chan DC. Physiological functions of mitochondrial fusion. Ann N Y Acad Sci. 2010;1201:21–25. - PubMed
Publication types
MeSH terms
Substances
LinkOut - more resources
Full Text Sources
Other Literature Sources
Molecular Biology Databases
