. 2014 Feb 18;111(7):2536-41.
doi: 10.1073/pnas.1316390111. Epub 2014 Feb 3.

ATP turnover by individual myosin molecules hints at two conformers of the myosin active site

Affiliations

ATP turnover by individual myosin molecules hints at two conformers of the myosin active site

Mamta Amrute-Nayak et al. Proc Natl Acad Sci U S A. .

Abstract

Coupling of ATP hydrolysis to structural changes in the motor domain is fundamental to the driving of motile functions by myosins. Current understanding of this chemomechanical coupling is primarily based on ensemble average measurements in solution and muscle fibers. Although important, the averaging could potentially mask essential details of the chemomechanical coupling, particularly for mixed populations of molecules. Here, we demonstrate the potential of studying individual myosin molecules, one by one, for unique insights into established systems and to dissect mixed populations of molecules where separation can be particularly challenging. We measured ATP turnover by individual myosin molecules, monitoring appearance and disappearance of fluorescent spots upon binding/dissociation of a fluorescent nucleotide to/from the active site of myosin. Surprisingly, for all myosins tested, we found two populations of fluorescence lifetimes for individual myosin molecules, suggesting that termination of fluorescence occurred by two different paths, unexpected from standard kinetic schemes of myosin ATPase. In addition, molecules of the same myosin isoform showed substantial intermolecular variability in fluorescence lifetimes. From kinetic modeling of our two fluorescence lifetime populations and earlier solution data, we propose two conformers of the active site of myosin, one that allows the complete ATPase cycle and one that dissociates ATP uncleaved. Statistical analysis and Monte Carlo simulations showed that the intermolecular variability in our studies is essentially due to the stochastic behavior of enzyme kinetics and the limited number of ATP binding events detectable from an individual myosin molecule with little room for static variation among individual molecules, previously described for other enzymes.

Keywords: ATP dwell times; TIRF microscopy; dwell time distribution; single ATP turnover assay.


Conflict of interest statement

The authors declare no conflict of interest.

Figures
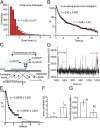
Fig. 1.
Fig. 1.
Dwell time distributions of M. psoas myosin-2; ensemble versus individual molecule. (A) Histogram of 3′Cy3–EDA–ATP dwell times recorded from 26 myosin-2 molecules extracted from a single rabbit psoas muscle fiber (n = 1,916 events). Solid line, single exponential decay function fitted to the histogram, time constant of 0.58 ± 0.077 s. (B) Same data as in A replotted as a “cumulative dwell time distribution.” For this plot, the start of each individual dwell time event was aligned at time = 0, and the number of dwells not yet ended is plotted versus time; that is, the cumulative dwell time distribution represents the decay of dwell events with time. Experimental data (open squares) were fitted to a double exponential decay function, the cumulative distribution function (cdf, red solid line). The semilogarithmic plot demonstrates the need of two exponential terms to account for the observed dwell time distribution, irrespective of inclusion of first time bin. The majority of events are part of a population with a time constant (τ1) of 0.45 ± 0.007 s. The other population has a time constant τ2 = 3.68 ± 0.45 s. (C) Scheme of the experimental arrangement to collect dwell time events from individual myosin molecules. (D) Time course of fluorescence intensity in a region of interest (4 × 4 pixels). For images of individual spots, see Fig. S1. The periods of high fluorescence intensity were assumed to start with the binding of a 3′Cy3–EDA–ATP molecule to the active site of a myosin molecule. Red and green horizontal arrows depict individual on time and off time events, respectively. (E) Example of a cumulative dwell time histogram of events recorded from an individual myosin molecule. Note that this cumulative dwell time histogram still shows two distinct populations. (F) Bar diagram for τ1 and τ2—that is, for short- and long-lived dwell time populations, respectively—derived from the cumulative dwell time distributions of 95 individual myosin molecules. Error bars, ±SD. (G) Relative incidence of short- and long-lived dwell time events, A1 and A2, of the two populations. Error bars, ±SD.
Fig. 2.
Fig. 2.
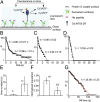
Dwell time distributions of single-headed M761-2R constructs of D. discoideum myosin-2. (A) Experimental arrangement for single-headed D. discoideum M761-2R constructs on a protein G/Alexa488–Penta–His antibody-coated surface. Colocalization of Cy3–EDA–ATP events and Alexa488-labeled Penta–His antibody to identify individual myosin molecules. Excess of His-peptide made binding of two M761-2R-molecules to a Penta–His antibody unlikely. (B–D) Dwell time distributions of individual D. discoideum M761-2R molecules. B and C show two molecules with two distinct populations, whereas D is a rare example with only one definite long-lived event. (E) Time constants for short- and long-lived dwell time populations found in 103 molecules; difference between τ1 and τ2 statistically significant (P < 0.0001). (F) Relative incidence, A1 and A2, of short- and long-lived dwell time events, respectively. Error bars, ±SD. (G) Typical cumulative waiting time (off time) distribution of an individual molecule. Red line is fit to a single exponential decay function, time constant 26.06 s.
Fig. 3.
Fig. 3.
(A) Incidence and lifetime of dwell time events throughout the observation period of 2,000 s. Each data point represents one observed dwell time. Each symbol represents data of one individual molecule. Data of 11 individual D. discoideum M761-2R molecules. Long and short dwell times appear randomly distributed throughout the observation period—that is, the incidence of long-lived events is essentially constant throughout the observation period, as is the incidence of short-lived events. (B) Average time constants of the two dwell time populations for different types of myosin. Summary of time constants for the fast (τ1) and slow (τ2) components derived from five different types of myosin. τ1 and τ2 are averages of individual molecule data for psoas myosin-2 (n = 95 individual molecules, N = 10,326 events), soleus myosin-2 (n = 80, N = 8,188), and the D. discoideum M761-2R construct (n = 103, N = 8,511). Dwell times of D. discoideum myosin-1B (N = 266) and D. discoideum myosin-5b (N = 400) were directly plotted in a cumulative dwell time distribution (ensemble analysis). τ1 ranged from 0.3 to1.3 s; τ2 was between 3.0 and 11.5 s. Error bars, ±SEM. For each myosin, the difference between τ1 and τ2 is statistically significant (P < 0.0001) and indicated by asterisks. All experiments were done at 22–25 °C.
Fig. 4.
Fig. 4.
(A) Effect of free Mg2+ ion concentration on the cumulative dwell time distribution of D. discoideum myosin-5b. Black squares, dwell time distribution at 0.5 mM free Mg2+ ions; total number of events, n = 300. Red circles, dwell time distribution at 4 mM free Mg2+, n = 400. The increase in free Mg2+ did not significantly alter the short-lived population (τ1, 0.82 ± 0.04 s vs. 0.89 ± 0.04 s; A1, 86 ± 2.5% vs. 76 ± 1.7%), however τ2 was increased 1.5-fold. (B) Effect of F387Y mutation in myosin-1B. Red circles and black squares, dwell time distributions for wild-type myosin-1B (n = 266 dwell time events) and mutation F387Y (n = 292), respectively. Red and black solid lines, fits to double and single exponential function, respectively. Fast population for mutant and wild-type myosin essentially identical. Incidence of long-lived events for wild-type myosin-1B was 11.8 ± 1.6%. Data of mutant consistent with two dwell time populations with same time constants as the wild type, however with only about as few as one-tenth of long-lived events seen with the wild type.
Fig. 5.
Fig. 5.
Kinetic scheme for myosin ATPase. M, myosin; M*, myosin with increased intrinsic fluorescence; M**, myosin with further increased intrinsic fluorescence; M', second conformer of myosin that does not hydrolyze ATP. T, ATP; D, ADP; Pi, inorganic phosphate.

References

    1. Lymn RW, Taylor EW. Mechanism of adenosine triphosphate hydrolysis by actomyosin. Biochemistry. 1971;10(25):4617–4624. - PubMed
    1. Huxley HE. The mechanism of muscular contraction. Science. 1969;164(3886):1356–1365. - PubMed
    1. Huxley AF. Muscular contraction. J Physiol. 1974;243(1):1–43. - PMC - PubMed
    1. Bagshaw CR, Trentham DR. The characterization of myosin-product complexes and of product-release steps during the magnesium ion-dependent adenosine triphosphatase reaction. Biochem J. 1974;141(2):331–349. - PMC - PubMed
    1. Johnson KA, Taylor EW. Intermediate states of subfragment 1 and actosubfragment 1 ATPase: Reevaluation of the mechanism. Biochemistry. 1978;17(17):3432–3442. - PubMed

Publication types

LinkOut - more resources