. 2014 Feb 18;111(7):2554-9.
doi: 10.1073/pnas.1312570111. Epub 2014 Feb 3.

Loss of the tumor suppressor LKB1 promotes metabolic reprogramming of cancer cells via HIF-1α

Affiliations

Loss of the tumor suppressor LKB1 promotes metabolic reprogramming of cancer cells via HIF-1α

Brandon Faubert et al. Proc Natl Acad Sci U S A. .

Abstract

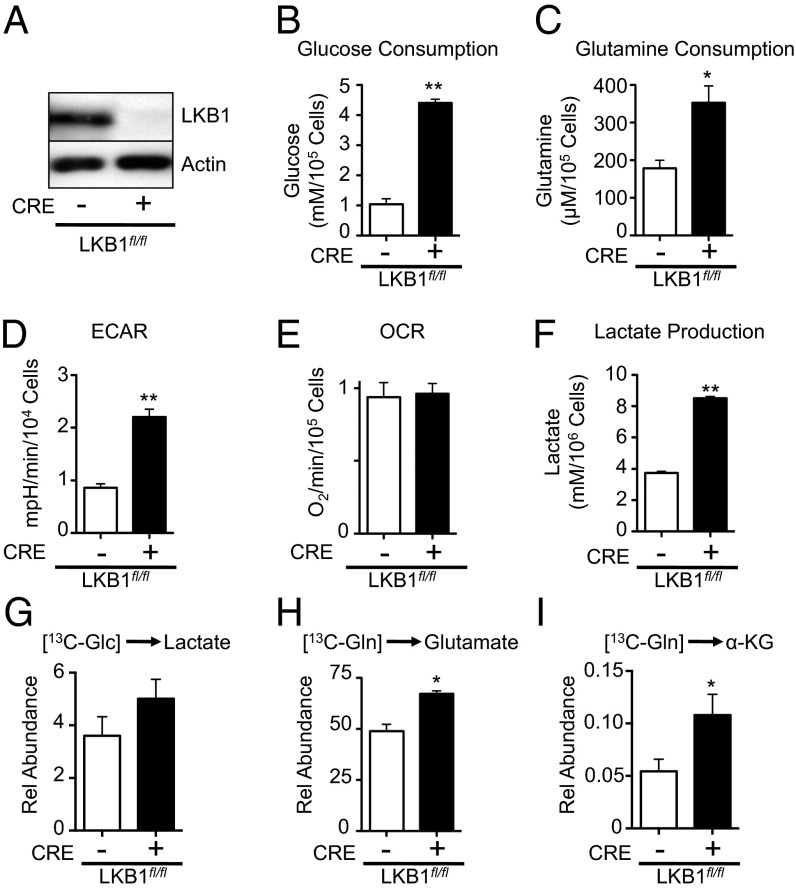
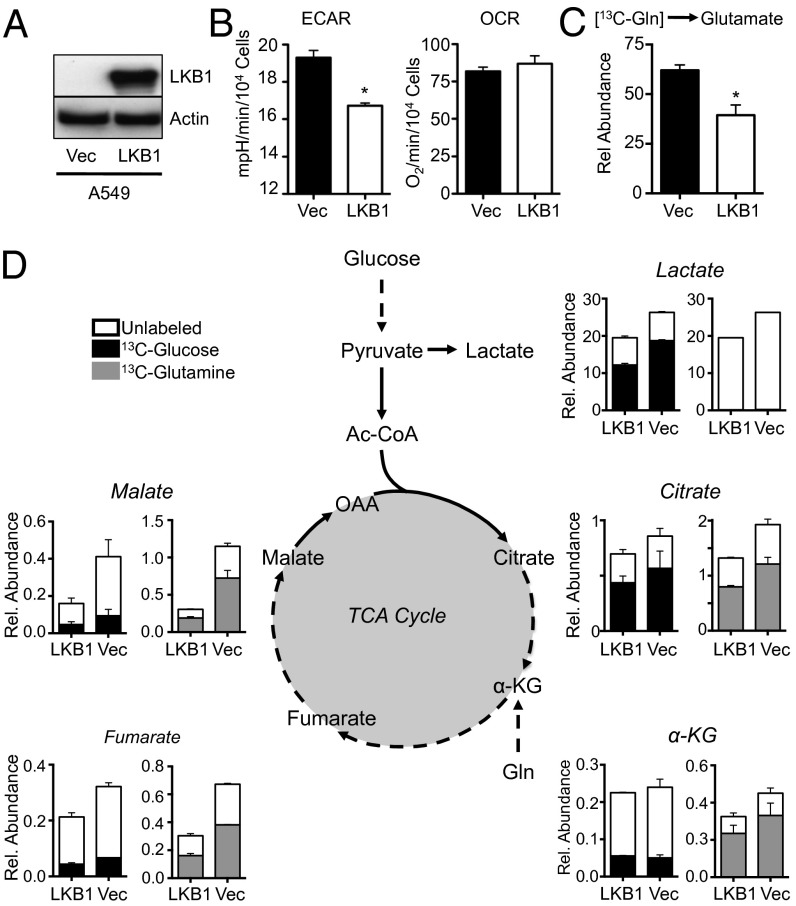
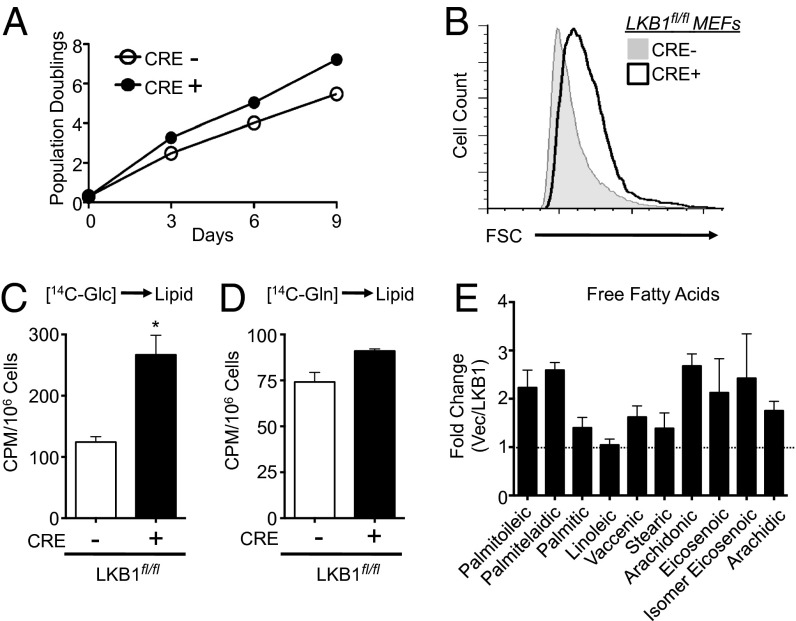
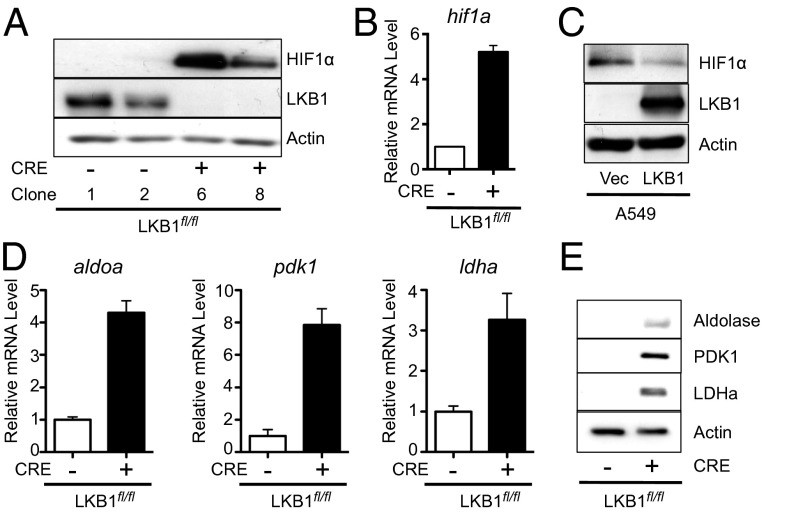
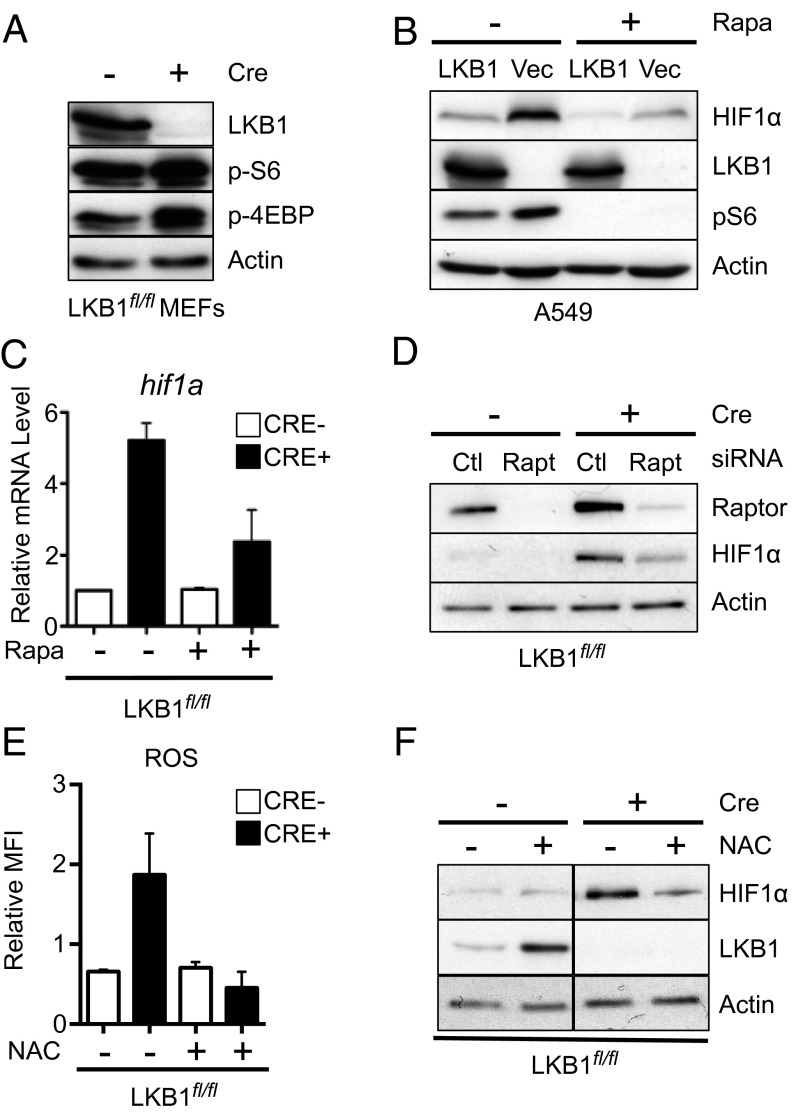
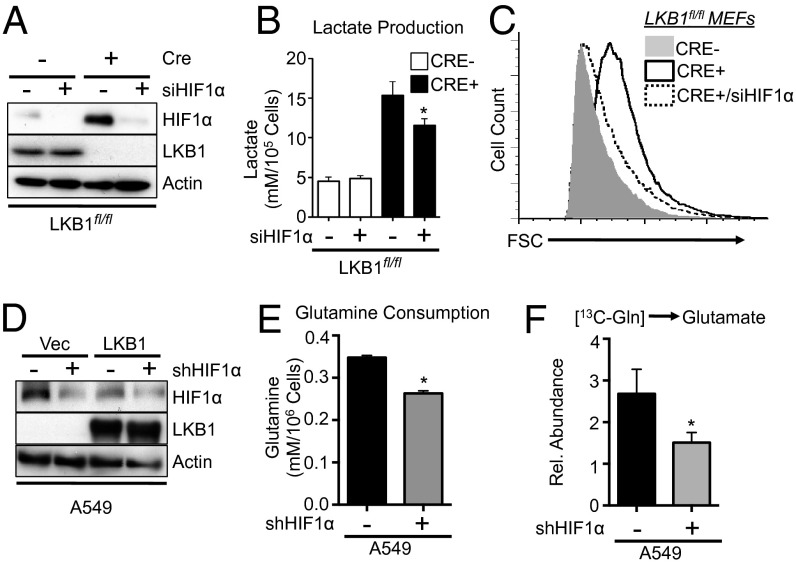
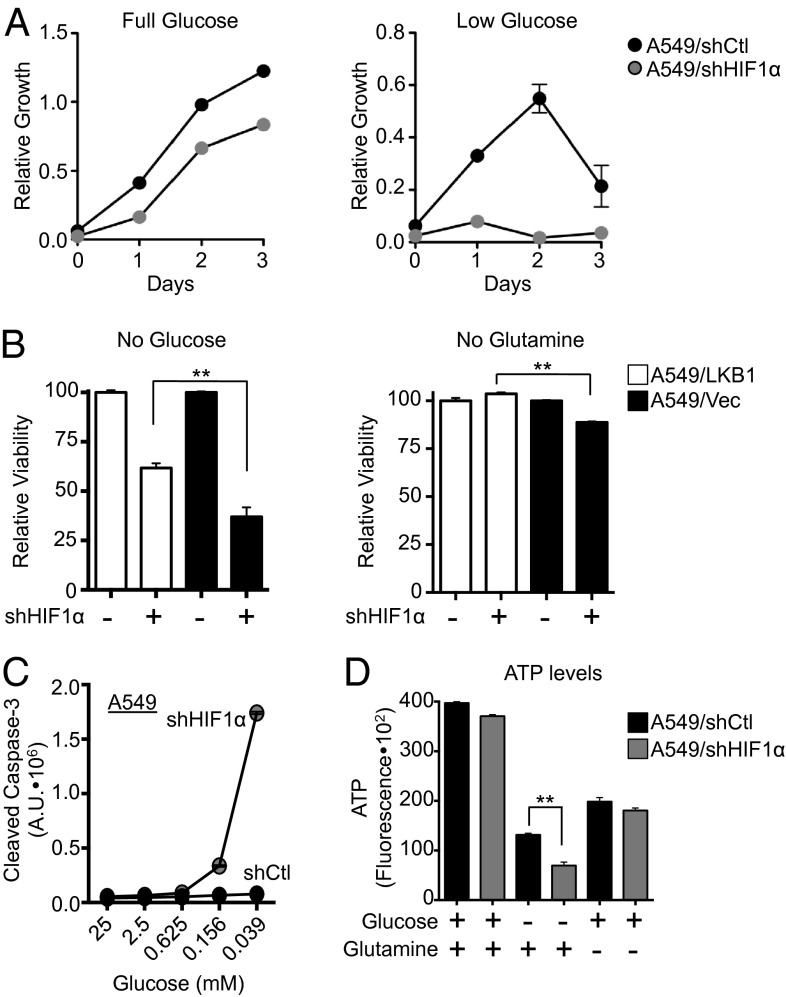
One of the major metabolic changes associated with cellular transformation is enhanced nutrient utilization, which supports tumor progression by fueling both energy production and providing biosynthetic intermediates for growth. The liver kinase B1 (LKB1) is a serine/threonine kinase and tumor suppressor that couples bioenergetics to cell-growth control through regulation of mammalian target of rapamycin (mTOR) activity; however, the influence of LKB1 on tumor metabolism is not well defined. Here, we show that loss of LKB1 induces a progrowth metabolic program in proliferating cells. Cells lacking LKB1 display increased glucose and glutamine uptake and utilization, which support both cellular ATP levels and increased macromolecular biosynthesis. This LKB1-dependent reprogramming of cell metabolism is dependent on the hypoxia-inducible factor-1α (HIF-1α), which accumulates under normoxia in LKB1-deficient cells and is antagonized by inhibition of mTOR complex I signaling. Silencing HIF-1α reverses the metabolic advantages conferred by reduced LKB1 signaling and impairs the growth and survival of LKB1-deficient tumor cells under low-nutrient conditions. Together, our data implicate the tumor suppressor LKB1 as a central regulator of tumor metabolism and growth control through the regulation of HIF-1α-dependent metabolic reprogramming.

Keywords: HIF-1alpha; PJS; Peutz-Jeghers Syndrome; Warburg effect; cancer metabolism; glutamine metabolism.


Conflict of interest statement

The authors declare no conflict of interest.

Figures

Fig. 1.
Fig. 1.
Loss of LKB1 promotes enhanced glucose and glutamine metabolism. (A) LKB1 immunoblot on lysates from LKB1fl/fl MEFs transduced with control retrovirus (Cre−) or a retrovirus expressing Cre recombinase (Cre+). (B and C) Glucose and glutamine consumption by LKB1-deficient MEFs. LKB1fl/fl MEFs expressing empty vector (open bar) or Cre recombinase (filled bar) were grown for 72 h, and glucose consumption (B) and glutamine consumption (C) were determined by enzymatic assay. (D and E) ECAR (D) and OCR (E) for LKB1fl/fl MEFs with (+) or without (−) Cre expression. (F) Lactate production by LKB1-deficient MEFs. Cells were treated as in B, and extracellular lactate in the culture medium was measured via enzymatic assay. (GI) Metabolic processing of glucose and glutamine by LKB1-null MEFs. LKB1-null (filled bar) or control (open bar) MEFs were pulsed with 13C-glucose or 13C-glutamine for 1 h, and 13C incorporation into lactate (G), glutamate (H), and α-ketoglutarate (I) was determined by GC-MS. *P < 0.05; **P < 0.01.
Fig. 2.
Fig. 2.
LKB1-deficient tumor cells display enhanced glycolytic and TCA cycle flux. (A) LKB1 immunoblot on lysates from A549 cells transduced with empty vector (Vec) or LKB1 cDNA. (B) ECAR and OCR of A549 cells expressing empty vector (filled bar) or LKB1 cDNA (open bar). (C) Intracellular glutamate levels derived from 13C-glutamine in A549 cells expressing empty vector (Vec, filled bar) or LKB1 (LKB1, open bar) as measured by GC-MS. (D) Metabolic flux analysis of LKB1-deficient A549 cells. A549 cells expressing empty vector (Vec) or LKB1 cDNA (LKB1) were pulsed with 13C-glucose or 13C-glutamine for 1 h, and 13C incorporation into lactate and TCA cycle metabolites were determined by GC-MS. Relative incorporation of 13C into total metabolite pools is indicated by shaded bars for glucose (black) and glutamine (gray). Metabolite abundance is expressed relative to basal levels in A549/LKB1 cells. *P < 0.05.
Fig. 3.
Fig. 3.
LKB1-null cells display enhanced growth and biosynthetic capacity. (A) Growth curve of LKB1fl/fl MEFs expressing empty vector (CRE−, open circle) or Cre recombinase (CRE+, filled circle) following a 3T3 passage protocol. (B) Size of control (Cre−, gray histogram) or LKB1-deficient (Cre+, open histogram) MEFs as determined by forward scatter (FSC) of cells via flow cytometry. (C and D) Glucose- and glutamine-dependent lipid biosynthesis by LKB-null MEFs. Control (Cre−,open bar) or LKB1-null (Cre+, closed bar) MEFs were incubated with uniformly labeled 14C-glucose (C) or 14C-glutamine (D) for 72 h, and radioactive counts in extracted lipids were measured. Data are expressed as cpm per 106 cells (mean ± SEM) for samples in triplicate. (E) Free fatty acid (FFA) levels in LKB1-null cancer cells. FFAs in cell extracts from A549/Vec or A549/LKB1 cells were measured by GC-MS following 3 d of growth. Data are expressed as the ratio of FFA species in A549/Vec to A549/LKB1 cells. *P < 0.05.
Fig. 4.
Fig. 4.
LKB1 loss promotes HIF-1α protein expression under normoxic conditions. (A) Immunoblot for HIF-1α protein expression in whole-cell lysates from control (Cre−) or LKB1-null (Cre+) MEFs grown under 20% O2. (B) Relative expression of hif1a mRNA by control (Cre−, open bar) or LKB1-null (Cre+, filled bar) MEFs as determined by qPCR. Data were expressed relative to actin mRNA levels for triplicate samples and normalized relative to control (Cre−) cells. (C) Immunoblot of HIF-1α protein in lysates from A549/Vec or A549/LKB1 cells grown under 20% O2. (D) Relative expression of aldoa, ldha, and pdk1 mRNA levels in control (Cre-, open bar) or LKB1-null (Cre+, filled bar) MEFs as determined by qPCR. (E) Immunoblot for Aldolase, PDK1, and LDHA expression in lysates from cells as in D.
Fig. 5.
Fig. 5.
LKB1-dependent HIF1α expression is regulated by mTORC1 and ROS. (A) Immunoblot for LKB1, pS6, p4EBP, and actin protein levels in whole-cell lysates from control (Cre−) or LKB1-null (Cre+) MEFs. (B) Immunoblot for HIF-1α protein levels in A549/Vec or A549/LKB1 cells cultured with (+) or without (−) 25 nM rapamycin for 24 h before cell lysis. Levels of LKB1, pS6, and actin are shown. (C) Relative HIF-1α mRNA expression in MEFs cells from control (Cre−) or LKB1-deficient (Cre+) MEFs treated with 25 nM rapamycin or vehicle control for 24 h. (D) Immunoblot for Raptor and HIF-1α protein levels in whole-cell lysates from control (Cre−) and LKB1-null (Cre+) MEFs treated with control (Ctl) or Raptor-specific (Rapt) siRNA. (E) Relative mean fluorescence intensity (MFI) of DFC-DA staining in LKB1fl/fl cells with (+) or without (−) Cre expression. Cells were treated with or without 10mM N-acetyl cysteine (NAC) for 1 h before ROS measurements. (F) Representative immunoblot of HIF-1α protein expression for cells treated as in E.
Fig. 6.
Fig. 6.
HIF-1α promotes the metabolic program induced by LKB1 loss. (A) Immunoblot of HIF-1α protein expression in lysates from control (Cre−) or LKB1-deficient (Cre+) MEFs treated with control or HIF-1α siRNA. LKB1 and actin levels are shown. (B) Lactate production by cells treated as in A after 72 h of growth. (C) Forward scatter (FSC) of control (gray histogram), LKB1-deficient (open histogram), or LKB1-deficient MEFs expressing HIF-1α siRNA (hatched histogram). (D) Immunoblot of HIF-1α protein levels in lysates from A549/Vec or A549/LKB1 cells expressing control (−) or HIF-1α–specific (+) shRNAs. LKB1 and actin levels are shown. (E) Glutamine consumption by A549 cells expressing control (black bar) or HIF-1α–specific (gray bar) shRNAs as determined by enzymatic assay. (F) Glutamine-derived glutamate levels in A549 cells expressing control (−) or HIF-1α–specific (+) shRNA. 13C incorporation into intracellular glutamate following 1 h of culture with 13C-glutamine was determined by GC-MS. *P < 0.05.
Fig. 7.
Fig. 7.
HIF-1α is required for the growth and survival of LKB1-deficient cells in response to nutrient limitation. (A) Growth curves of A549 cells expressing control (black circle) or HIF-1α (gray circle) shRNA grown under full (25 mM) or low (0.4 mM) glucose conditions. (B) Viability of A549/LKB1 (white bars) or A549/Vec (black bars) cells expressing control (−) or HIF-1α–specific (+) shRNA following culture in glucose- or glutamine-free media. Cell viability was measured after 48 h by propidium iodide uptake. (C) Caspase-3 activation in A549 cells expressing control (Vec, black circles) or HIF-1α–specific (gray circles) shRNA following culture in decreasing concentrations of glucose. (D) Relative ATP levels of A549 cells expressing control (black bars) or HIF-1α–specific (gray bars) shRNA following culture in glucose- or glutamine-free media. **P < 0.01.

References

    1. DeBerardinis RJ, Lum JJ, Hatzivassiliou G, Thompson CB. The biology of cancer: Metabolic reprogramming fuels cell growth and proliferation. Cell Metab. 2008;7(1):11–20. - PubMed
    1. Vander Heiden MG, Cantley LC, Thompson CB. Understanding the Warburg effect: The metabolic requirements of cell proliferation. Science. 2009;324(5930):1029–1033. - PMC - PubMed
    1. Deberardinis RJ, Sayed N, Ditsworth D, Thompson CB. Brick by brick: Metabolism and tumor cell growth. Curr Opin Genet Dev. 2008;18(1):54–61. - PMC - PubMed
    1. Jones RG, Thompson CB. Tumor suppressors and cell metabolism: A recipe for cancer growth. Genes Dev. 2009;23(5):537–548. - PMC - PubMed
    1. Pan JG, Mak TW. Metabolic targeting as an anticancer strategy: Dawn of a new era? Sci STKE. 2007;2007(381):pe14. - PubMed

Publication types

MeSH terms

LinkOut - more resources