. 2014 Feb 18;111(7):2704-9.
doi: 10.1073/pnas.1315943111. Epub 2014 Feb 3.

Ischemic neurons recruit natural killer cells that accelerate brain infarction

Affiliations

Ischemic neurons recruit natural killer cells that accelerate brain infarction

Yan Gan et al. Proc Natl Acad Sci U S A. .

Abstract

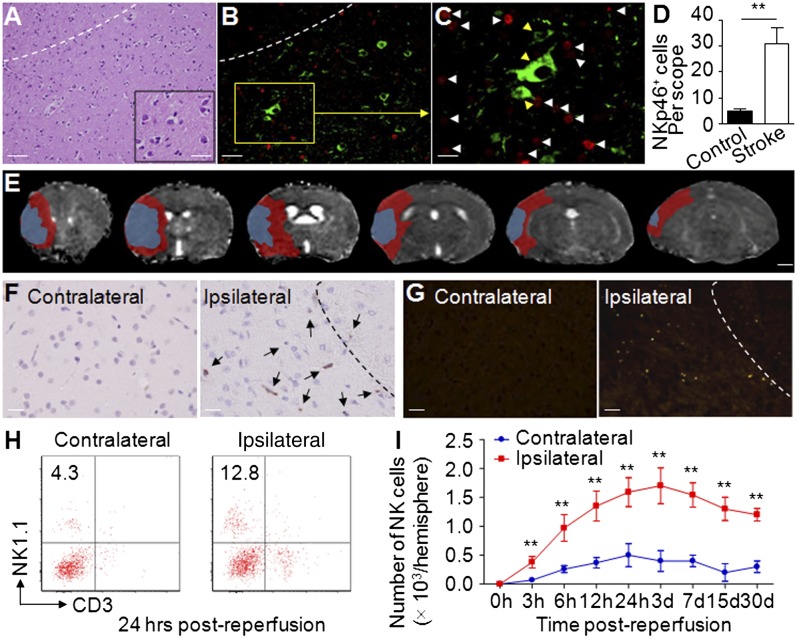
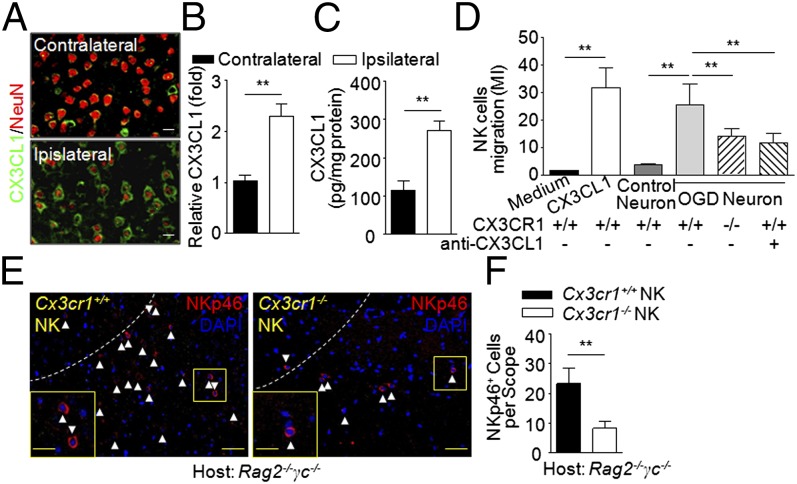
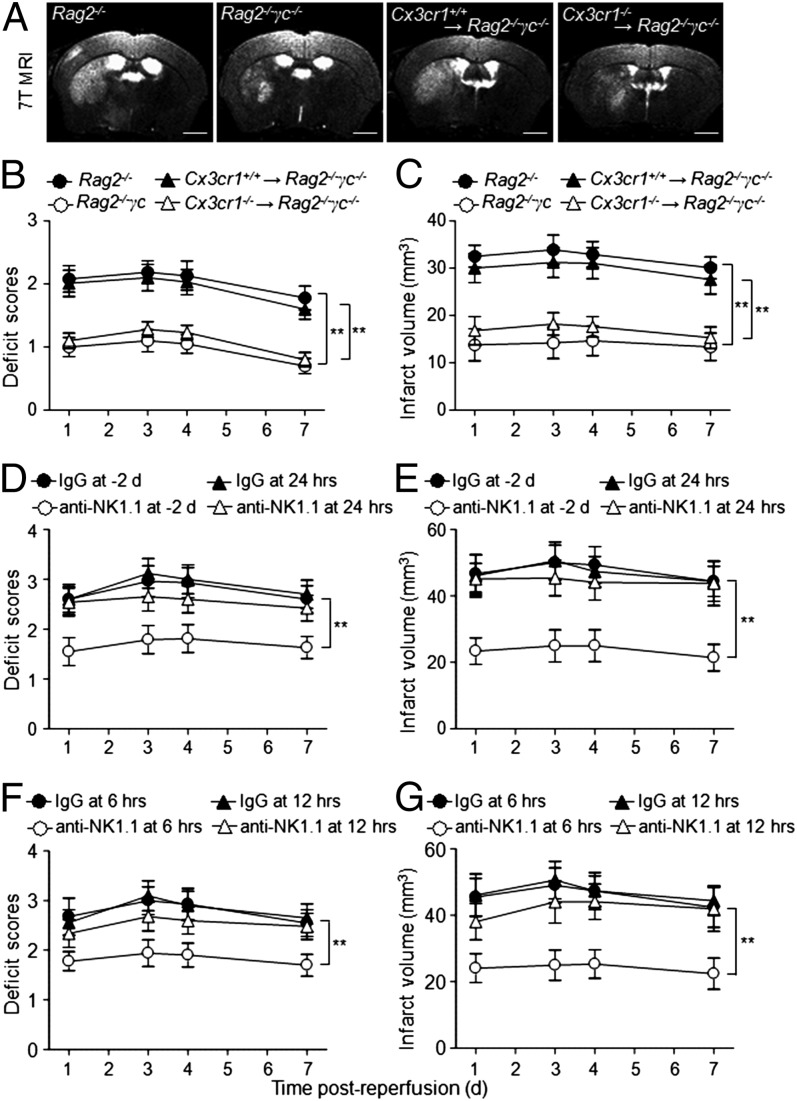
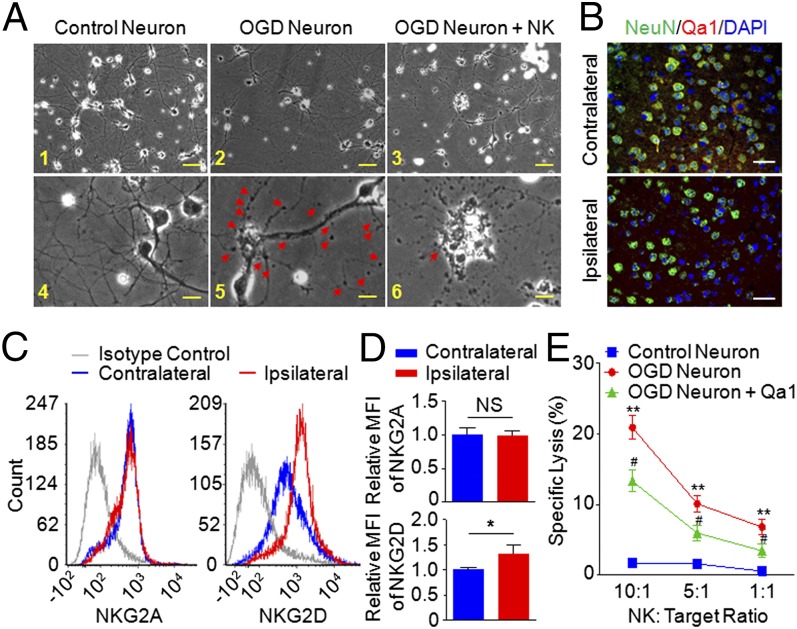
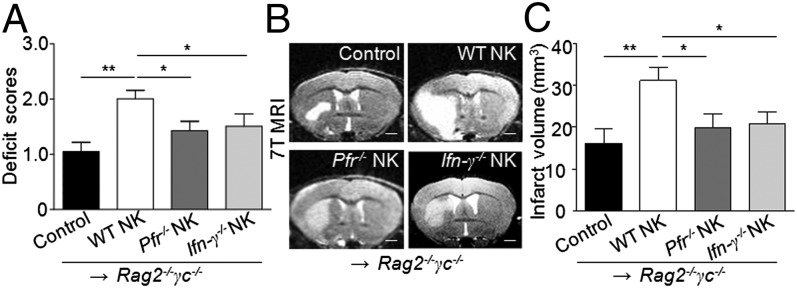
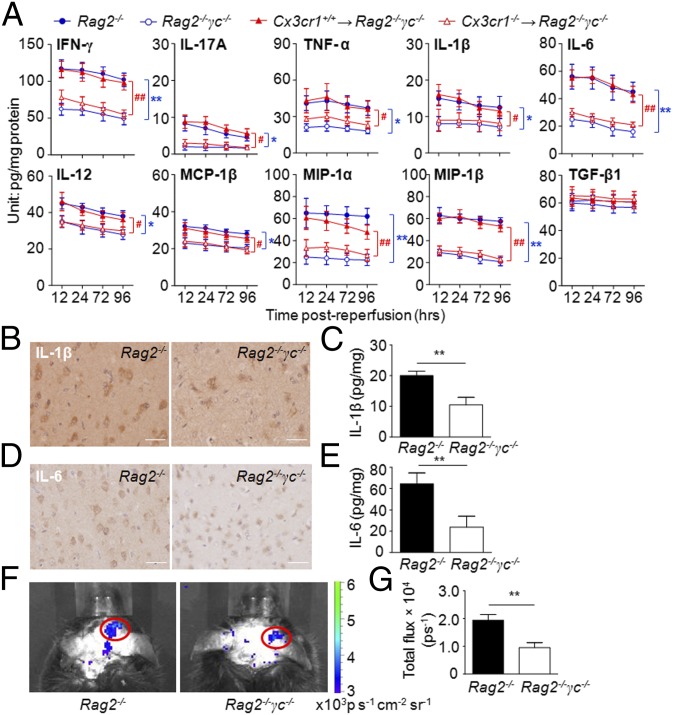
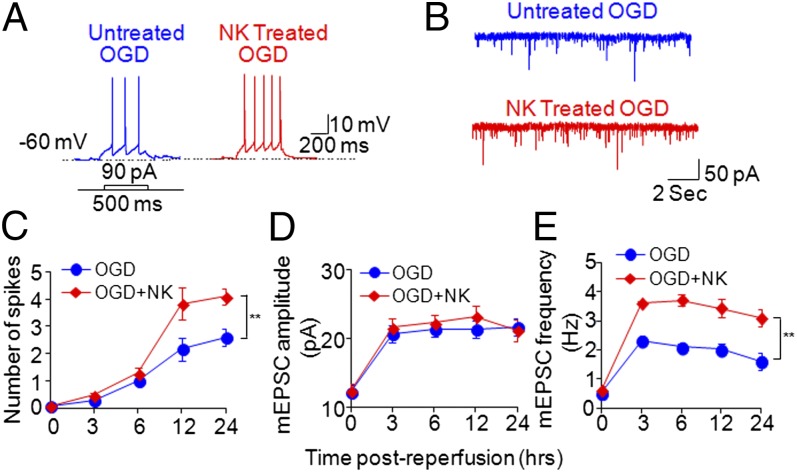
Brain ischemia and reperfusion activate the immune system. The abrupt development of brain ischemic lesions suggests that innate immune cells may shape the outcome of stroke. Natural killer (NK) cells are innate lymphocytes that can be swiftly mobilized during the earliest phases of immune responses, but their role during stroke remains unknown. Herein, we found that NK cells infiltrated the ischemic lesions of the human brain. In a mouse model of cerebral ischemia, ischemic neuron-derived fractalkine recruited NK cells, which subsequently determined the size of brain lesions in a T and B cell-independent manner. NK cell-mediated exacerbation of brain infarction occurred rapidly after ischemia via the disruption of NK cell tolerance, augmenting local inflammation and neuronal hyperactivity. Therefore, NK cells catalyzed neuronal death in the ischemic brain.

Keywords: innate immunity; ischemic stroke; middle cerebral artery occlusion.


Conflict of interest statement

The authors declare no conflict of interest.

Figures

Fig. 1.
Fig. 1.
Accumulation of NK cells in brain infarct. (A) A brain section from patient with acute middle cerebral artery ischemic stroke shows infiltrating inflammatory cells, predominantly located in the infarct and periinfarct area. (B) Infiltrating NKp46+ cells (red) in the infarct and periinfarct areas on brain slices from a patient with middle cerebral artery ischemic stroke. (C) NK cells (white arrowheads) are in close proximity to ischemic neurons (yellow arrowheads) in the periinfarct area (green, βIII-tubulin; red, NKp46; blue, DAPI). For AC, representative sections of a patient with MCAO. (D) Quantification of NK cells infiltrating in brain sections from patients with MCAO. n = 8 for stroke patients; n = 6 for nonneurological disease controls. (E) Representative perfusion–diffusion mismatch in a WT MCAO mouse. Blue indicates abnormal diffusion area, whereas red indicates the ischemic penumbra as defined by perfusion–diffusion mismatch. (Scale bar, 1.5 mm.) (F) Immunohistochemical staining of NKp46+ NK cells in MCAO brain paraffin sections. NK cells (arrows) were predominantly located in periinfarct areas (areas separated by dashed line). Data were acquired from 12 WT mice, 24 h after MCAO. (G) Accumulation of NKp46+ NK cells in MCAO brain was confirmed in NK1.1-tdTomato transgenic mice by immunostaining. NK cells are labeled with the red chromophore tdTomato in this strain. Infiltration of NK cells (red) was further confirmed by immunofluorescent staining with antibody to NKp46 (green). The yellow (merged) dots indicate that NK cells were primarily in periinfarct areas (separated by dashed line) at 24 h after MCAO. Data are from 12 mice. (H and I) Time courses of NK cells infiltrating the ipsilateral hemisphere. Cell infiltrates were isolated from brain homogenates. Kinetics of NK cell infiltration over the course of stroke were quantified by FACS. Experiments were repeated five times; n = 12 mice per group per time point. [Scale bars, 40 μm (A, Left), 10 μm (A, Inset), 40 μm (B), 20 μm (C), 1 mm (E), 50 μm (F and G).] **P < 0.01.
Fig. 2.
Fig. 2.
Ischemic brain-derived fractalkine attracts NK cells. (A and B) Immunostaining (A) and quantification (B) of CX3CL1 in MCAO brain slices tracked in 12 mice 24 h after MCAO. (Scale bars, 7 μm.) (C) Quantification of CX3CL1 in MCAO brain homogenates (pg/mg protein) by ELISA. Tissues were obtained 24 h after MCAO. n = 8. (D) Transwell assays show that NK cell migration was driven by ischemic neuron-derived CX3CL1. Cx3cr1+/+ (WT) or Cx3cr1−/− NK cells (2 × 10⁵) seeded on transwell inserts. The lower chambers of the transwells received soluble CX3CL1 (10 nM), control neurons, ischemic neurons, ischemic neuron plus anti-CX3CL1 antibody, or no stimulus. Subsequently, cell migration index (MI) was assayed: number of cells migrating toward chemoattractants/number of cells migrating toward medium in the absence of any stimulant. Bars represent means of triplicate wells from three independent experiments. **P < 0.01. (E and F) Deficiency of CX3CR1 impaired NK cell-homing into the ischemic brain. NK cells were sorted from pooled splenocytes of Cx3cr1+/+ or Cx3cr1−/− mice. Purified Cx3cr1+/+ or Cx3cr1−/− NK cells (>99%; Fig. S3) were passively transferred (i.v. 5 × 10⁵ per mouse) into Rag2−/−γc−/− recipients before MCAO. (E) Representative images show more NKp46+ cells in brains of Rag2−/−γc−/− MCAO mice given Cx3cr1+/+ NK cell transfers compared with recipients of Cx3cr1−/− NK cell transfers 24 h after MCAO. Dotted lines indicate border of infarct. [Scale bars, 40 μm; 20 μm (Inset).] (F) The quantification of transferred NK cells infiltrating into the ipsilateral hemispheres 24 h after MCAO was graphed. **P < 0.01.
Fig. 3.
Fig. 3.
NK cells are associated with brain infarct volume. (AC) Representative 7T MRI images (A) and quantification of neurological deficits (B) and infarct volumes (C) in MCAO mice with NK cells (Rag2−/−) vs. without NK cells (Rag2−/−γc−/−), as well as more (Cx3cr1+/+ NK→Rag2−/−γc−/−) vs. less (Cx3cr1−/− NK→Rag2−/−γc−/−) NK cells in the brain. Rag2−/−γc−/− MCAO mice had relatively mild neurological deficits and smaller infarct volumes than Rag2−/− MCAO mice. Reconstitution of Cx3cr1+/+ but not Cx3cr1−/− NK cells restored the ischemic lesions in Rag2−/−γc−/− mice. Data generated from 15 mice per group. **P < 0.01. (Scale bars, 1 mm.) (DG) Determination of the time window in which NK cells exert detrimental effects in stroke. WT mice were treated with anti-NK1.1 mAb or isotype control IgG Ab 2 d before MCAO or at 6, 12, and 24 h after reperfusion, respectively. Treatment regimen and efficiency of cell depletion are described elsewhere (16, 30). Neurological deficits (D and F) were assessed, and infarct volumes (E and G) were determined by MRI in conjunction with TTC staining. Attenuation was more pronounced when NK cells were depleted preceding MCAO or within the first 12 h after MCAO. n = 8 per group. **P < 0.01.
Fig. 4.
Fig. 4.
NK cell-mediated killing of ischemic neurons. (A, 1–6) Morphological changes of neurons induced by coculture with NK cells. Cultured healthy control neurons extended several dendritic trunks, and the dendrites had numerous protrusions (1 and 4). The ischemic neurons induced the formation of bead-like structures (arrowheads) and a decrease of fine protrusions (2 and 5). IL-2–activated NK cells caused severe neuronal destruction and loss (3 and 6). A remaining neuron showed fragmented axons and dendrites. The arrow indicates an NK cell in contact with the cell body of an ischemic neuron (6). Images are representative of five fields acquired from each group in triplicates of four separate experiments. [Scale bars, 50 µm (1–3), 10 µm (4–6).] (B) Loss of Qa1 expression on ischemic neurons. Brain slices from MCAO mice were stained with anti-Qa1 (red) and NeuN (green) mAb, which detected the MHC class Ib molecule Qa1 and neuron, respectively. n = 6. (Scale bars, 50 µm.) (C and D) Expression of NKG2A and NKG2D on NK cells from contralateral and ischemic hemisphere. Single-cell suspensions were prepared 24 h after stroke induction from the brains of the indicated groups. The expressions of NKG2A and NKG2D on NK cells were determined by FACS (C), and the quantification was graphed (D). The histograms are from one representative of 12 WT MCAO mice analyzed. MFI, mean fluorescent intensity. (E) Killing of ischemic neurons was measured by 51Cr release assay. Target cells (cultured control neurons, ischemic neurons, or Qa1 overexpressing ischemic neurons) were labeled with 51Cr. Effector cells were the IL-2 (10 μg/mL), IL-15 (10 μg/mL), and LPS (5 μg/mL) activated NK cells. Cytotoxicity was measured at 10:1; 5:1 and 1:1 (effector:target) ratio. Each value represents the mean ± SEM of the response of NK cells from three individual cell culture wells. Data represent four separate experiments. **P < 0.01 vs. control neuron. #P < 0.05 vs. ischemic neuron.
Fig. 5.
Fig. 5.
Perforin and INF-γ are required for NK cell-mediated detrimental effects in stroke. NK cells (5 x10⁵) were sorted from pooled splenocytes of WT, perforin-deficient (Pfr−/−), or IFN-γ–deficient (Ifn-γ−/−) mice and i.v. injected into Rag2−/−γc−/− mice, followed by the MCAO procedure. (A) Quantification of neurological deficits in Rag2−/−γc−/− recipients of NK cells with or without perforin or IFN-γ. Mice devoid of NK cells (Rag2−/−γc−/−), after receiving perforin-deficient NK cells (Pfr−/− NK) or IFN-γ–deficient NK cells (Ifn-γ−/− NK), had relatively mild neurological deficits compared with Rag2−/−γc−/− mice receiving the same number of functionally competent NK cells (WT NK). (B) 7T MRI images depict the size of brain infarction in mice from each group. Rag2−/−γc−/− MCAO mice receiving Pfr−/− NK or Ifn-γ−/− NK mice had smaller infarct volumes than those receiving competent NK cells. (Scale bars, 1 mm.) (C) Quantification of infarct volume by ImageJ analysis of MRI images. Rag2−/−γc−/− MCAO mice without NK cell transfer served as controls. (AC) n = 8 mice per group, 24 h after MCAO. *P < 0.05; **P < 0.01.
Fig. 6.
Fig. 6.
Absence of NK cells is associated with reduced poststroke inflammatory response in the brain. (A) Absence of NK cells reduces brain inflammation during stroke. Brain homogenates were prepared from mice of the indicated groups 12, 24, 72, and 96 h after MCAO. Cytokine concentrations were measured by a Multi-Analyte ELISArray Kit (SABiosciences). Results shown are from three independent experiments with a pool of n = 4 mice per group per time point. *P < 0.05, **P < 0.01, Rag2−/−γc−/− vs. Rag2−/−; #P < 0.05, ##P < 0.01, Cx3cr1+/+ NK→Rag2−/−γc−/− vs. Cx3cr1−/− NK→Rag2−/−γc−/−. (BE) Lack of NK cells is associated with reduced expression of inflammatory mediators in the ischemic brain. Representative images of immunostaining for IL-1β and IL-6 from brain sections of an infarct hemisphere from mice with (Rag2−/−) or without (Rag2−/−γc−/−) NK cells (B and D) and quantification of cytokines (C and E) at 24 h after the MCAO procedure by ELISA. (Scale bars, 20 µm.) n = 8 per group. **P < 0.01. (F and G) Lack of NK cells reduced ROS generation in stroke. (F) Imaging ROS activity in vivo. Bioluminescent images were captured for 1 min using the cooled IVIS imaging system (Xenogen IVIS-200) after luminol i.p. injection, as recently described (16, 23, 33), to monitor the ROS generation in Rag2−/− and Rag2−/−γc−/− MCAO brains. (G) Quantification and statistical analysis of the images. Rag2−/− and Rag2−/−γc−/− mice had significant differences in ROS levels after MCAO. Data were generated 12 h after MCAO, with seven mice per group. **P < 0.01.
Fig. 7.
Fig. 7.
NK cells increase ischemic neuronal excitability and synaptic excitatory transmission. Cultured cortical neurons underwent transient OGD (15 min), then recovered for 3, 6, 12, and 24 h with or without NK cells in the culture. Neuronal membrane excitability was assessed by counting action potential numbers in response to injection of 90-pA current for 500 ms. (A) Typical traces of action potential generation in response to 90-pA current injection show that treatment with NK cells enhanced neuronal excitability in OGD neurons followed by reperfusion. (B) Treatment with NK cells enhanced mEPSCs recorded from OGD neurons followed by reperfusion. (C) Time course for action potential spike activity (ordinate) as a function of currents injected (90 pA) at various time points after OGD in cultured cortical neurons. Results show that treatment with NK cells increased action potential numbers starting at 12 h after OGD. (D and E) Treatment with NK cells increased mEPSC frequency, starting at 3 h after OGD, but not mEPSC amplitude. Electrophysiology data were collected from eight cells in each group. **P < 0.01.

References

    1. Eltzschig HK, Carmeliet P. Hypoxia and inflammation. N Engl J Med. 2011;364(7):656–665. - PMC - PubMed
    1. Iadecola C, Anrather J. The immunology of stroke: From mechanisms to translation. Nat Med. 2011;17(7):796–808. - PMC - PubMed
    1. Eltzschig HK, Eckle T. Ischemia and reperfusion—from mechanism to translation. Nat Med. 2011;17(11):1391–1401. - PMC - PubMed
    1. Hurn PD, et al. T- and B-cell-deficient mice with experimental stroke have reduced lesion size and inflammation. J Cereb Blood Flow Metab. 2007;27(11):1798–1805. - PMC - PubMed
    1. Kleinschnitz C, et al. Early detrimental T-cell effects in experimental cerebral ischemia are neither related to adaptive immunity nor thrombus formation. Blood. 2010;115(18):3835–3842. - PubMed

Publication types

MeSH terms