. 2014 Feb 18;111(7):E748-57.
doi: 10.1073/pnas.1320956111. Epub 2014 Feb 3.

Mapping the molecular determinants of BRAF oncogene dependence in human lung cancer

Affiliations

Mapping the molecular determinants of BRAF oncogene dependence in human lung cancer

Luping Lin et al. Proc Natl Acad Sci U S A. .

Abstract

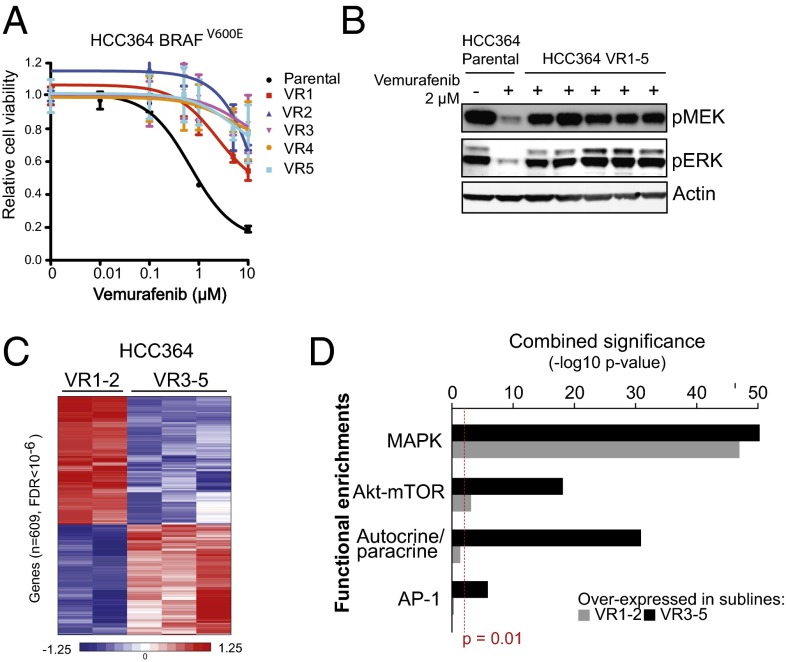
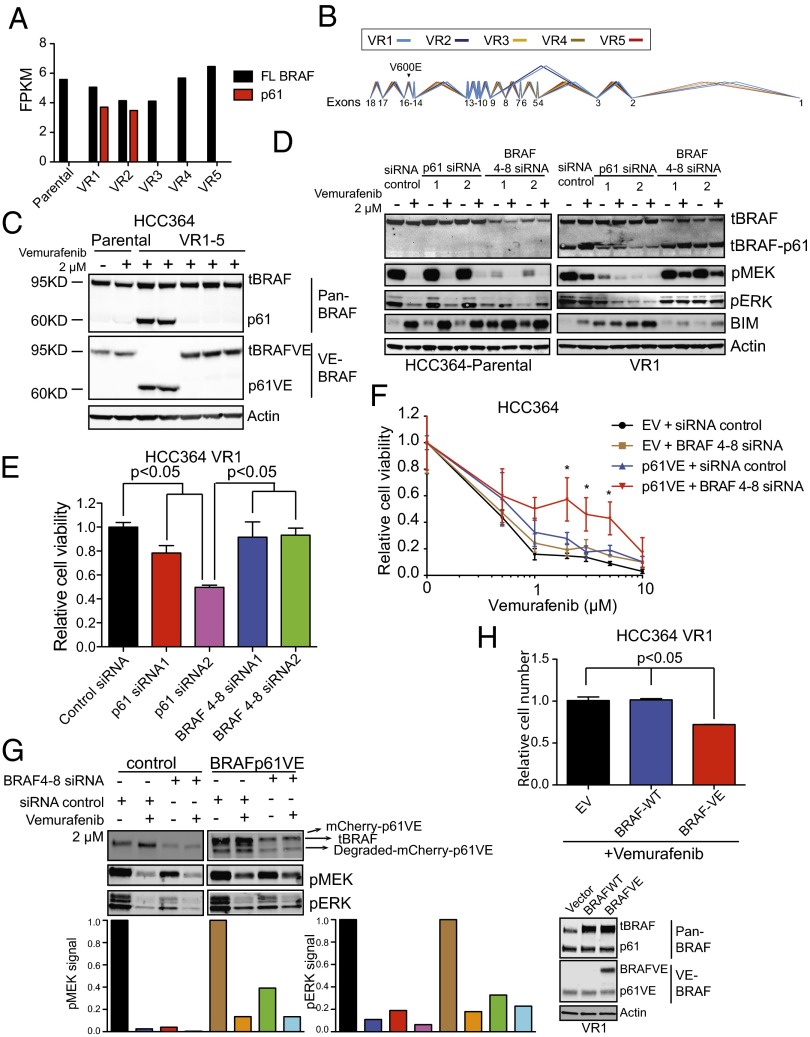
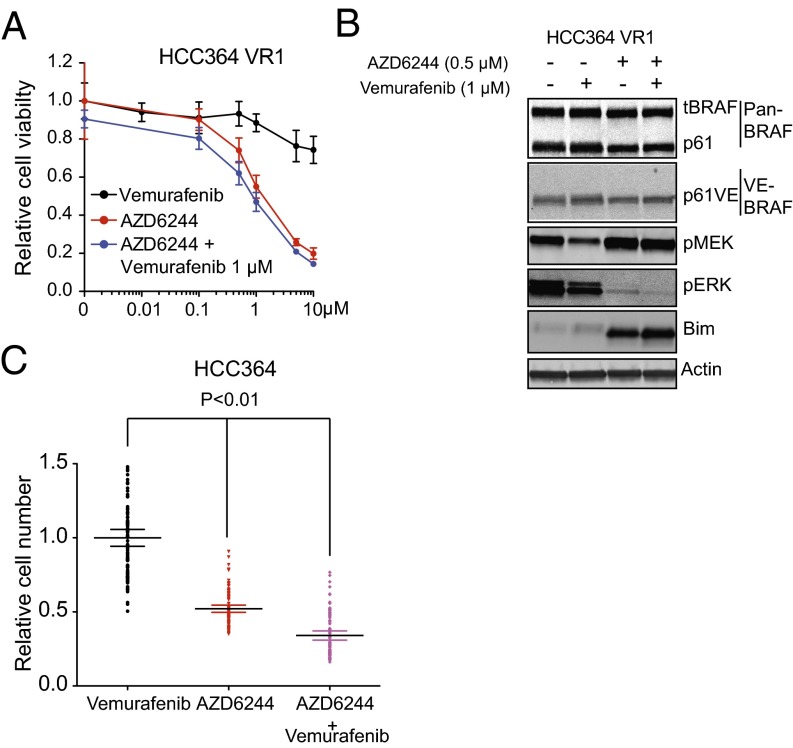
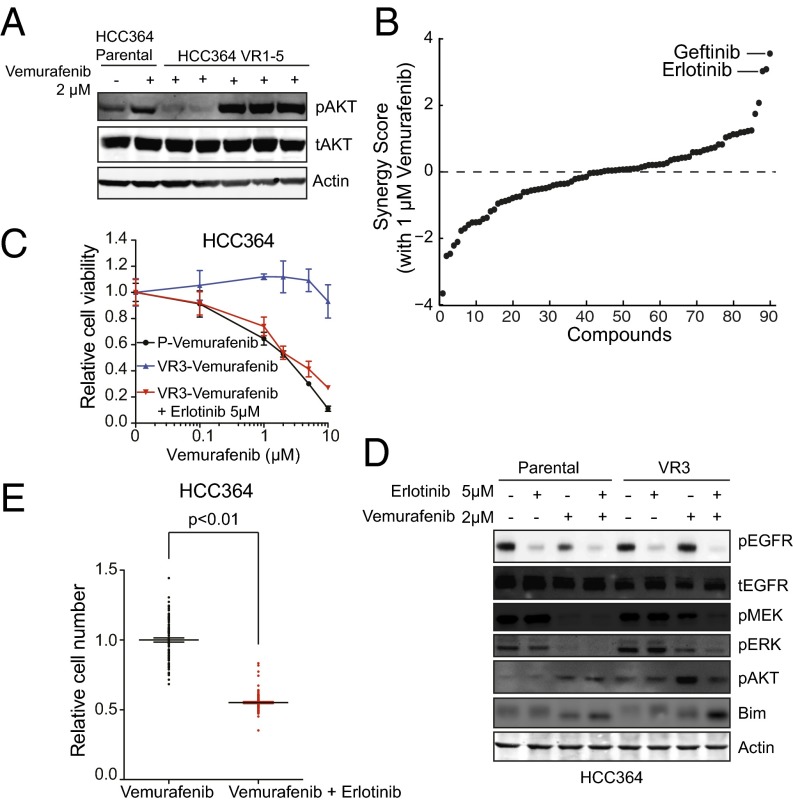
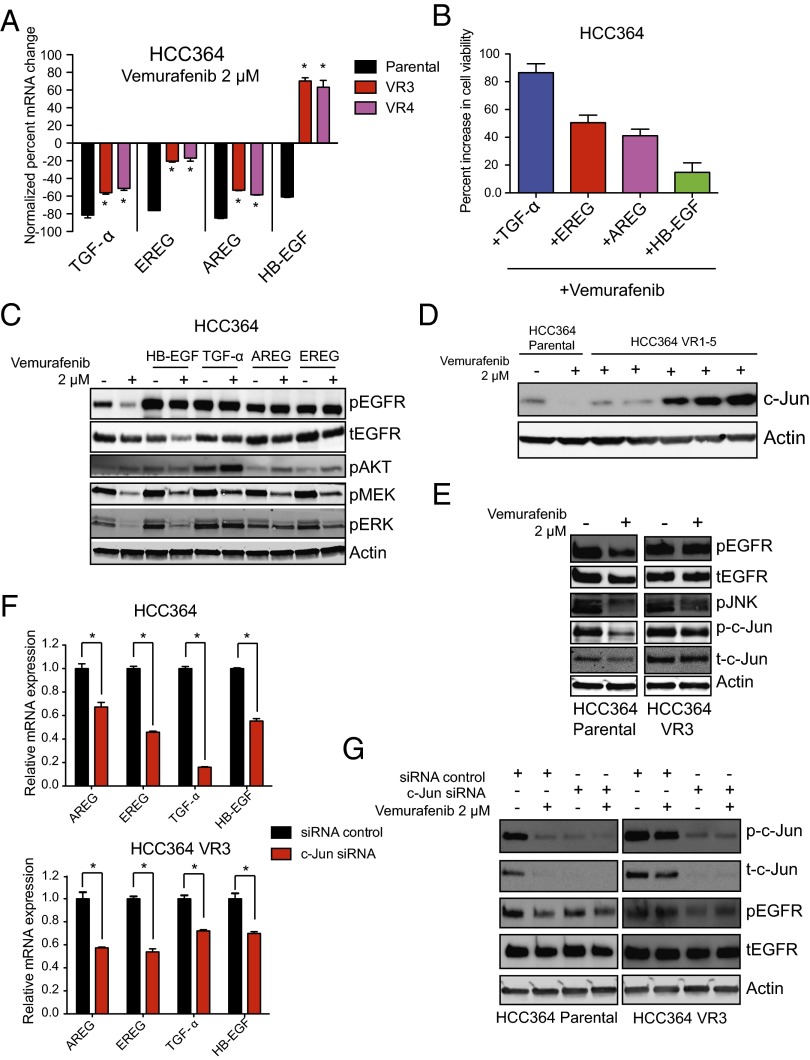
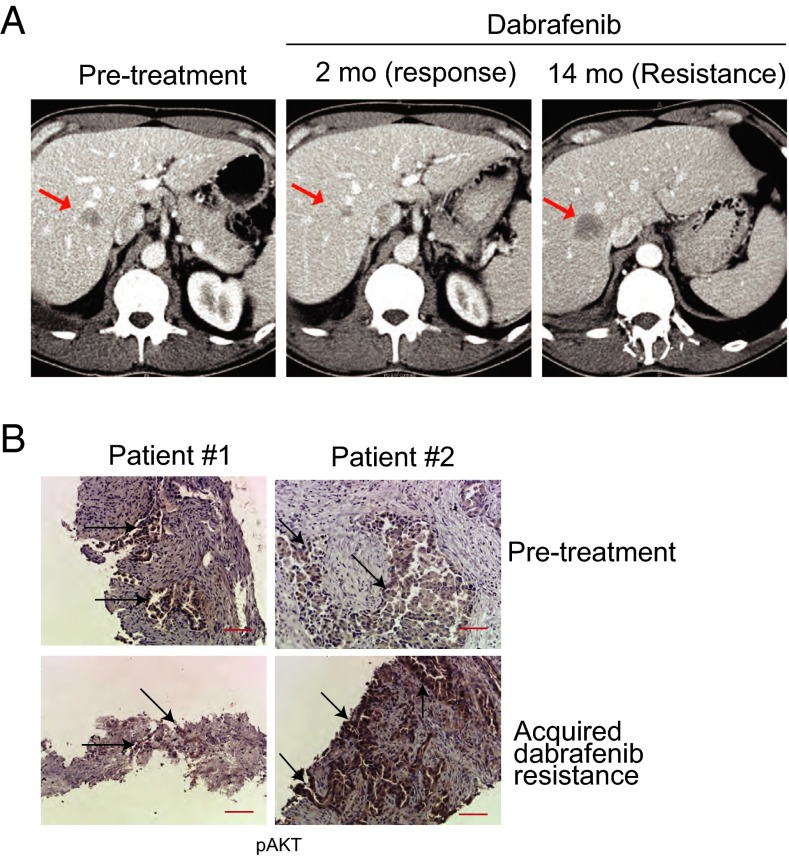
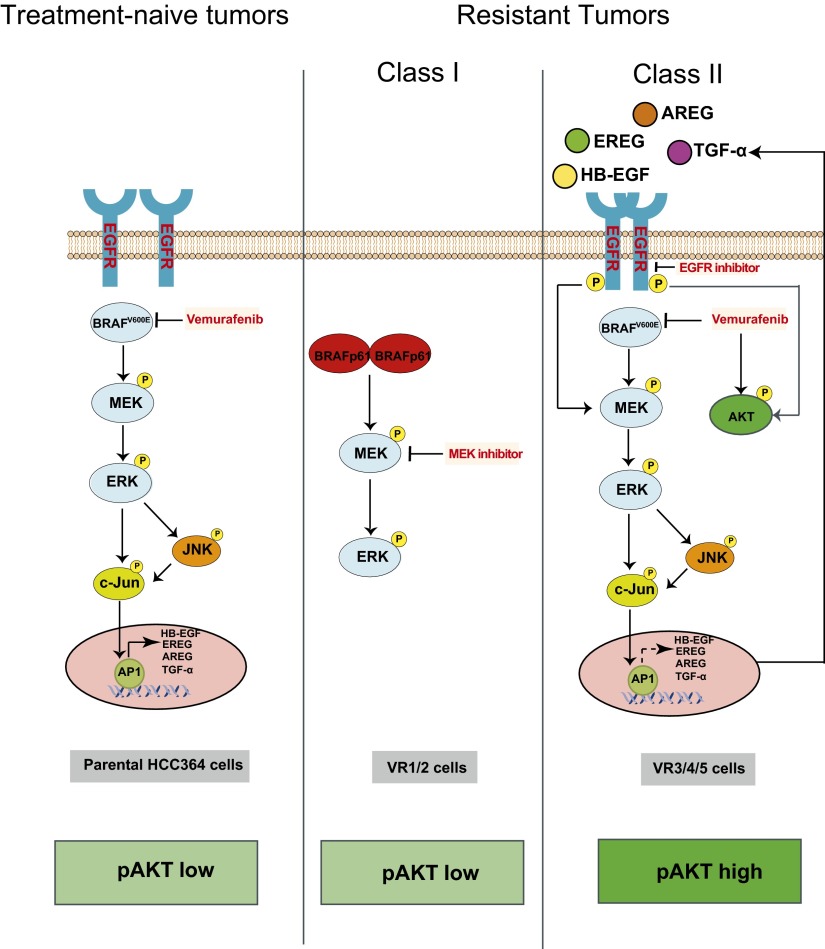
Oncogenic mutations in the BRAF kinase occur in 6-8% of nonsmall cell lung cancers (NSCLCs), accounting for more than 90,000 deaths annually worldwide. The biological and clinical relevance of these BRAF mutations in NSCLC is incompletely understood. Here we demonstrate that human NSCLC cells with BRAF(V600E), but not other BRAF mutations, initially are sensitive to BRAF-inhibitor treatment. However, these BRAF(V600E) NSCLC cells rapidly acquire resistance to BRAF inhibition through at least one of two discrete molecular mechanisms: (i) loss of full-length BRAF(V600E) coupled with expression of an aberrant form of BRAF(V600E) that retains RAF pathway dependence or (ii) constitutive autocrine EGF receptor (EGFR) signaling driven by c-Jun-mediated EGFR ligand expression. BRAF(V600E) cells with EGFR-driven resistance are characterized by hyperphosphorylated protein kinase AKT, a biomarker we validated in BRAF inhibitor-resistant NSCLC clinical specimens. These data reveal the multifaceted molecular mechanisms by which NSCLCs establish and regulate BRAF oncogene dependence, provide insights into BRAF-EGFR signaling crosstalk, and uncover mechanism-based strategies to optimize clinical responses to BRAF oncogene inhibition.

Keywords: combination therapy; targeted therapy.


Conflict of interest statement

The authors declare a conflict of interest. Gideon Bollag is an employee of Plexxikon Inc., which owns and markets vemurafenib.

Figures

Fig. 1.
Fig. 1.
BRAFV600E NSCLC models respond to BRAF-inhibitor treatment transiently and acquire drug resistance. (A) Dose–response curve showing the effect of vemurafenib on the viability of HCC364 parental cells and five vemurafenib-resistant lines. Data shown (±SEM) are normalized to the vehicle treatment (n = 3). (B) Western blot analysis of components of MAPK signaling in lysates from the HCC364 parental and each isogenic vemurafenib-resistant subline (VR1–VR5). Data represent three independent experiments. (C) Supervised hierarchical clustering using transcriptome datasets obtained by RNA-seq from HCC364 VR1–VR5 sublines. (D) Plot of functional gene set enrichment analysis indicating pathways significantly activated in the HCC364, VR1-VR2, and VR3–VR5 sublines.
Fig. 2.
Fig. 2.
A switch to p61VE is necessary and sufficient to drive BRAF-inhibitor resistance in the NSCLC models. (A) Expression of full-length (FL) or aberrant (p61) BRAF shown as fragments per kilobase of exon per million fragments mapped (FPKM) in each HCC364 cell line. (B) RNA sequencing reads that reflect splicing among exons is shown in VR1–VR5 lines demonstrating aberrant splicing of exons 3 and 9 indicated the absence of exons 4–8 in the VR1 and VR2 sublines only. Line widths reflect relative expression levels and in VR1-VR2 mirror the results in A. (C) Western blot analysis of each indicated protein in lysates from the HCC364 parental cell line and each isogenic vemurafenib-resistant subline (VR1–VR5). Data represent three independent experiments. (D) Western blot analysis of each indicated protein in lysates from HCC364 parental cells and from the isogenic vemurafenib-resistant subline VR1 transfected with p61 and full-length BRAF-specific siRNA. Data represent three independent experiments. (E) Effect of each indicated siRNA on the viability of HCC364 VR1 cells. Data shown (±SEM) are normalized to the vehicle treatment (n = 3). (F) Dose–response curve showing the effect of vemurafenib on the viability of HCC364 parental cells overexpressing either empty vector or p61VE plus either nontargeting siRNA (control) or BRAF siRNA targeting only full-length BRAF. Data are shown as ± SEM (n = 3). (G) Western blot analysis (Upper) and quantification (Lower) of each indicated protein in lysates from HCC364 parental cells overexpressing empty vector or p61VE plus either siRNA or BRAF siRNA targeting only full-length BRAF. Data represent three independent experiments. (H) (Upper) Relative cell number of HCC364 VR1 cells after transient transfection of empty vector, wild-type BRAF, or BRAF-V600E (BRAF-VE) constructs and treatment with 2 µM of vemurafenib. (Lower) Western blots for the indicated proteins in lysates from the VR1 cells analyzed. All cell-viability data shown are normalized to the control siRNA or vehicle treatment (n = 3, *P < 0.05).
Fig. 3.
Fig. 3.
Overriding p61VE-mediated signaling to suppress acquired resistance. (A and B) Dose–response curve showing the effect of each indicated inhibitor on cell viability (A) and activation of the indicated signaling components (B) in VR1 cells. Data in A are normalized to vehicle treatment, ±SEM (n = 3). (C) Effect of treatment with each indicated inhibitor on the development of acquired drug resistance in HCC364 cells as measured by clonal outgrowth assays. Data shown (±SEM) are normalized to vemurafenib treatment (n = 3, P < 0.01).
Fig. 4.
Fig. 4.
Engagement of EGFR signaling is necessary for BRAF-inhibitor resistance in the NSCLC models. (A) Western blot analysis of AKT phosphorylation in lysates from the HCC364 parental cell line and each isogenic vemurafenib-resistant subline (VR1–VR5). Data represent three independent experiments. (B) Synergy score plot for the chemical screening revealing small-molecule inhibitors that act synergistically with vemurafenib to diminish the viability specifically in the VR3 subline. Inhibitors targeting EGFR are labeled. (C) Dose–response curve showing the effects of vemurafenib on the viability of HCC364 parental cells (P) and VR3 cells treated with vemurafenib or with vemurafenib and erlotinib. Data shown (±SEM) are normalized to DMSO treatment (n = 3). (D) Western blot analysis of each indicated protein in lysates from HCC364 parental cells and VR3 cells treated with vemurafenib, erlotinib, or the combination as indicated. Data represent three independent experiments. (E) Effect of treatment with each indicated inhibitor on the development of acquired drug resistance in HCC364 cells as measured by clonal outgrowth assays. Data shown (±SEM) are normalized to the vemurafenib treatment (n = 3, P < 0.01).
Fig. 5.
Fig. 5.
Ligand-mediated EGFR signaling acting downstream of MAPK pathway activation regulates BRAFV600E oncogene dependence in NSCLC. (A) mRNA expression levels of each indicated EGFR ligand after 24 h of treatment with vemurafenib in HCC364 parental, VR3, and VR4 cells, expressed as normalized to HCC364 parental cells treated with control vehicle (n = 3, *P < 0.05). (B) Effect of growth factor stimulation on cell viability in HCC364 parental cells upon treatment with 2 µM vemurafenib. Data (±SEM) are expressed as the relative increase in viability observed during treatment with each ligand compared with vehicle control in cells treated with 2 µM vemurafenib (n = 3). (C) Western blot analysis of each indicated protein in lysates from the HCC364 parental cell line treated with the EGFR ligands TGF-α, AREG, EREG, and HB-EGF in the presence or absence of vemurafenib. Data represent three independent experiments. (D) Western blot analysis of c-Jun in lysates from the HCC364 parental cell line and each isogenic vemurafenib-resistant subline (VR1–VR5). Data represent three independent experiments. (E) Western blot analysis of each indicated protein in lysates from the HCC364 parental line and the VR3 cell line treated with vemurafenib. Data represent three independent experiments. (F) mRNA expression levels (±SEM) of the indicated genes as measured by quantitative RT-PCR in the HCC364 parental cells and in VR3 cells upon treatment with either nontargeting siRNA (control) or c-Jun siRNA (n = 3). (G) Western blot analysis of each indicated protein in lysates from the HCC364 parental cell line and from the VR3 cell line treated with vemurafenib alone or upon silencing of c-Jun by siRNA. Data shown (±SEM) are normalized to the control siRNA treatment (n = 3, *P < 0.05).
Fig. 6.
Fig. 6.
pAKT is a potential biomarker of acquired BRAF-inhibitor resistance in human NSCLC. (A) CT scans obtained before treatment and upon dabrafenib resistance in a patient with BRAFV600E NSCLC. Arrows indicate a metastatic liver lesion in this patient that was confirmed as BRAFV600E NSCLC and that initially responded and then progressed on continuous dabrafenib therapy. (B) Immunohistochemistry staining for pAKT in pretreatment and acquired resistance biopsies from two BRAFV600E NSCLC patients treated with the BRAF inhibitor dabrafenib. Arrows indicate pAKT+ tumor cells. (Scale bars: 50 μM.)
Fig. 7.
Fig. 7.
Model for the regulation of BRAF oncogene dependence in NSCLC. (Left) Model for BRAFV600E dependence in NSCLC in which BRAF–MEK–ERK signaling controls cell growth and survival and activation of EGFR by regulating EGFR ligand expression. BRAF oncogene inhibition suppresses MEK–ERK and c-Jun signaling, thereby simultaneously downregulating MAPK signaling and EGFR ligand expression and EGFR activation. (Center) Class I resistant cells in which a switch from full-length BRAFV600E to aberrant BRAFV600E (p61VE) relieves dependence on the native oncogene and promotes BRAF-inhibitor resistance. (Right) Class II resistant cells in which engagement of EGFR signaling via c-Jun–mediated up-regulation of EGFR ligand expression and activation drives BRAF-inhibitor resistance. BRAF oncogene dependence is diminished in these resistant cells by compensatory EGFR activation that likely occurs through the loss of exclusive BRAFV600E control over c-Jun signaling and, consequently, EGFR ligand expression and EGFR activation. Hyperphosphorylation of AKT occurs in these cells as a consequence of both BRAF inhibition and EGFR activation and therefore is a biomarker of EGFR-driven acquired resistance.

References

    1. Sawyers CL. The cancer biomarker problem. Nature. 2008;452(7187):548–552. - PubMed
    1. Garraway LA, Jänne PA. Circumventing cancer drug resistance in the era of personalized medicine. Cancer Discov. 2012;2(3):214–226. - PubMed
    1. Glickman MS, Sawyers CL. Converting cancer therapies into cures: Lessons from infectious diseases. Cell. 2012;148(6):1089–1098. - PMC - PubMed
    1. Zhang Z, et al. Activation of the AXL kinase causes resistance to EGFR-targeted therapy in lung cancer. Nat Genet. 2012;44(8):852–860. - PMC - PubMed
    1. Bivona TG, et al. FAS and NF-κB signalling modulate dependence of lung cancers on mutant EGFR. Nature. 2011;471(7339):523–526. - PMC - PubMed

Publication types

MeSH terms