Randomized Controlled Trial
. 2014 Mar 4;111(9):3608-13.
doi: 10.1073/pnas.1317908111. Epub 2014 Feb 18.

Cortisol shifts financial risk preferences

Affiliations
Randomized Controlled Trial

Cortisol shifts financial risk preferences

Narayanan Kandasamy et al. Proc Natl Acad Sci U S A. .

Abstract

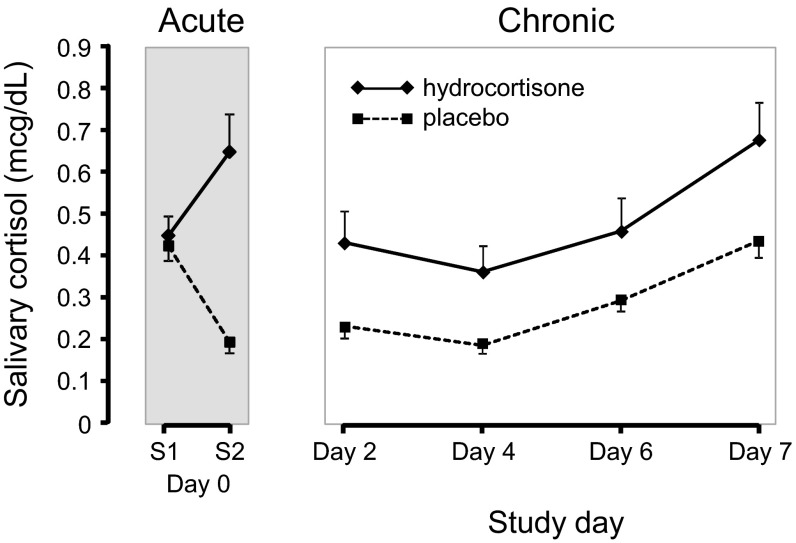
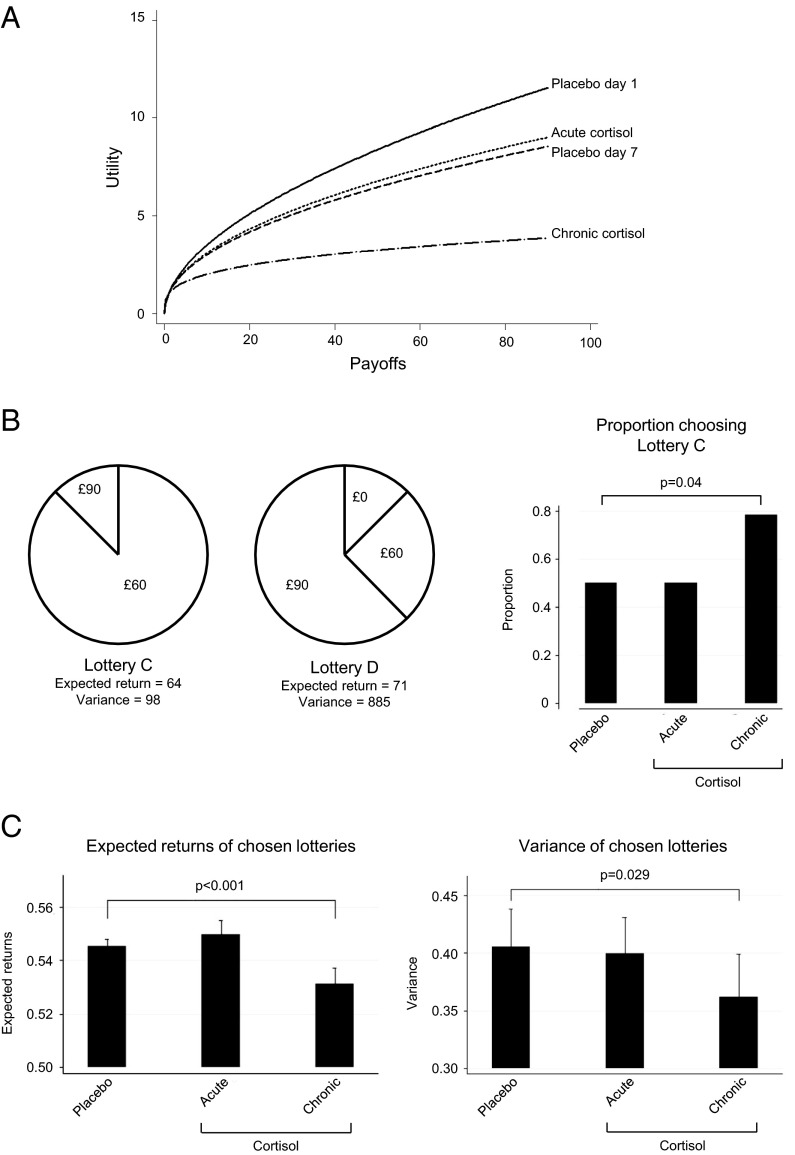
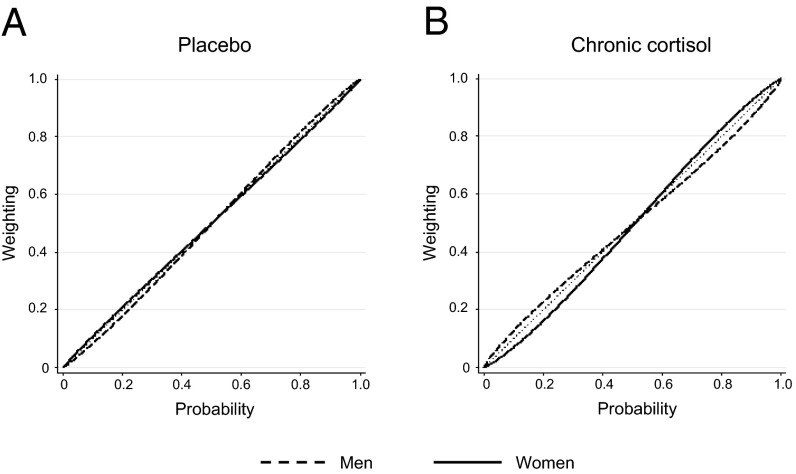
Risk taking is central to human activity. Consequently, it lies at the focal point of behavioral sciences such as neuroscience, economics, and finance. Many influential models from these sciences assume that financial risk preferences form a stable trait. Is this assumption justified and, if not, what causes the appetite for risk to fluctuate? We have previously found that traders experience a sustained increase in the stress hormone cortisol when the amount of uncertainty, in the form of market volatility, increases. Here we ask whether these elevated cortisol levels shift risk preferences. Using a double-blind, placebo-controlled, cross-over protocol we raised cortisol levels in volunteers over 8 d to the same extent previously observed in traders. We then tested for the utility and probability weighting functions underlying their risk taking and found that participants became more risk-averse. We also observed that the weighting of probabilities became more distorted among men relative to women. These results suggest that risk preferences are highly dynamic. Specifically, the stress response calibrates risk taking to our circumstances, reducing it in times of prolonged uncertainty, such as a financial crisis. Physiology-induced shifts in risk preferences may thus be an underappreciated cause of market instability.


Conflict of interest statement

The authors declare no conflict of interest.

Figures

Fig. 1.
Fig. 1.
Cumulative exposure to cortisol over 8 d. The acute plot shows average salivary cortisol levels on the first day of the study, before (day 0, S1) and 90 min after (day 0, S2) the first dose of hydrocortisone or placebo. The decline in cortisol levels observed in the placebo arm of day 0 is consistent with the normal diurnal rhythm of cortisol secretion. The chronic plot shows average cortisol levels on every second day of the study (days 2, 4, and 6) and on day 7 during the hydrocortisone and placebo schedules. Results are shown as means ± SEMs.
Fig. 2.
Fig. 2.
A sample screen from the computerized choice task. Participants were presented with two lotteries at a time, from which they chose to play one. In this example, lottery A offers the player the certainty of some return: a high probability of receiving £30 and a low probability of £90. Lottery B offers a higher chance of receiving £90 but also some chance of receiving £0. The expected return of lottery B is high relative to lottery A, but so is its variance (i.e., the dispersion of possible payouts), which range from £90 to £0. Lottery B is thus the risky bet, and lottery A the safe bet.
Fig. 3.
Fig. 3.
Effect of cortisol on risk aversion. (A) Changes in risk aversion as measured by the curvature of the utility function. Utility curves were averaged from all participants in the study. Utility can be thought of as the participants’ subjective valuation of the monetary outcomes. Most people derive a decreasing marginal utility from each increment in a bet’s payoff and are therefore risk-averse. The flatter their utility curve, the greater their risk aversion. (B) A sample lottery choice under placebo, acute, and chronically raised cortisol. In this sample choice, under chronically elevated cortisol, participants preferred the safer lottery C (P = 0.04). (C) Changes in the expected return and variance of the chosen lotteries. Under chronically raised cortisol participants chose safer lotteries (i.e., ones with lower payoffs and a lower variance of possible payoffs). Results are shown as means ± SEMs.
Fig. 4.
Fig. 4.
Probability weighting functions. The 45° line represents a linear increase in objective probability from 0% to 100%. The inverted S-shape curve centered on the 45° line represents the weighting of probabilities people display when making choices. When compared with placebo (A), under conditions of chronically elevated cortisol (B), men relative to women become more sensitive to small probabilities and less sensitive to large probabilities.

References

    1. Luigino B, Sugden R. The road not taken: How psychology was removed from economics, and how it might be brought back. Econ J. 2007;117(516):146–173.
    1. Gai P, Vause N. Measuring investors' risk appetite. Int J Cent Bank. 2006;2:167–188.
    1. European Central Bank (2007) Measuring investors' risk appetite. Financial Stability Review, June: 166–171.
    1. Samuelson L. Evolutionary Games and Equilibrium Selection. Vol 1. Cambridge, MA: MIT Press; 1998.
    1. Guiso L, Sapienza P, Zingales L. 2013. Time varying risk aversion. NBER Working Paper No. 19284 (National Bureau of Economic Research, Cambridge, MA)

Publication types

LinkOut - more resources