. 2014 Feb 13;10(2):e1004135.
doi: 10.1371/journal.pgen.1004135. eCollection 2014 Feb.

Integrated genomic characterization reveals novel, therapeutically relevant drug targets in FGFR and EGFR pathways in sporadic intrahepatic cholangiocarcinoma

Affiliations

Integrated genomic characterization reveals novel, therapeutically relevant drug targets in FGFR and EGFR pathways in sporadic intrahepatic cholangiocarcinoma

Mitesh J Borad et al. PLoS Genet. .

Abstract

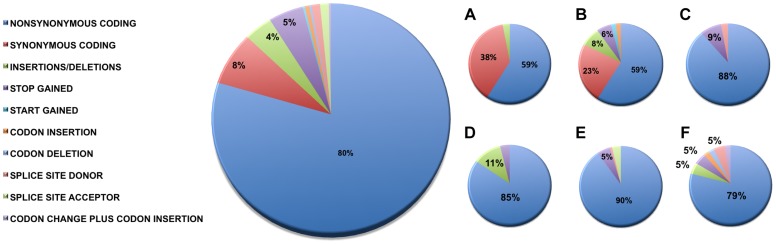
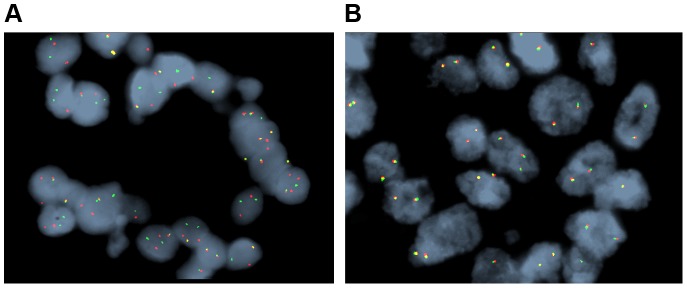
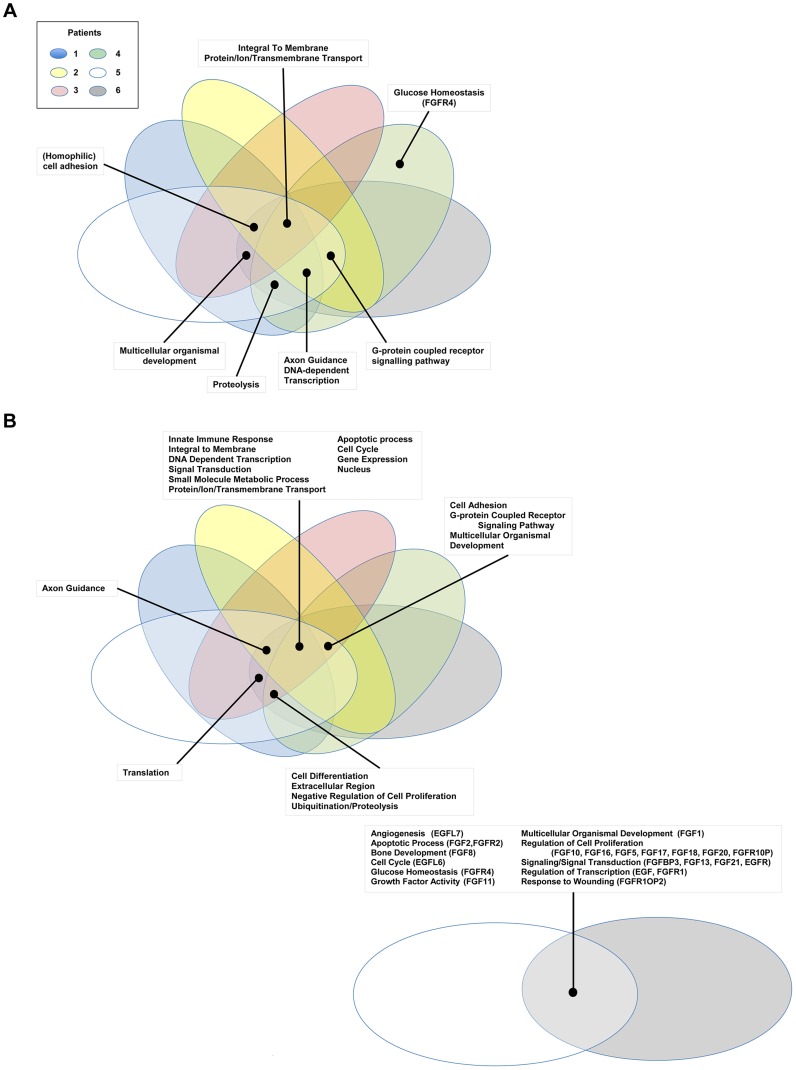
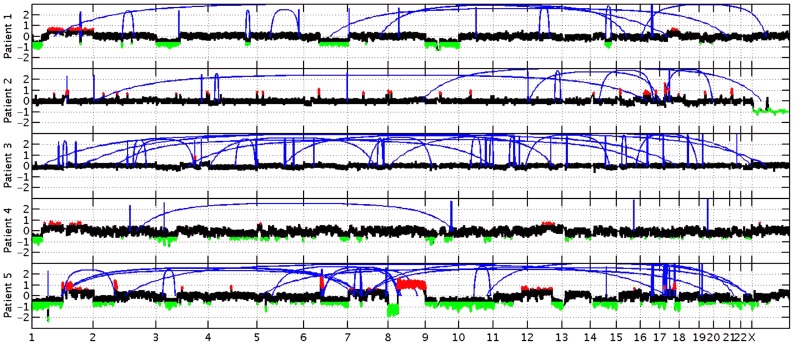
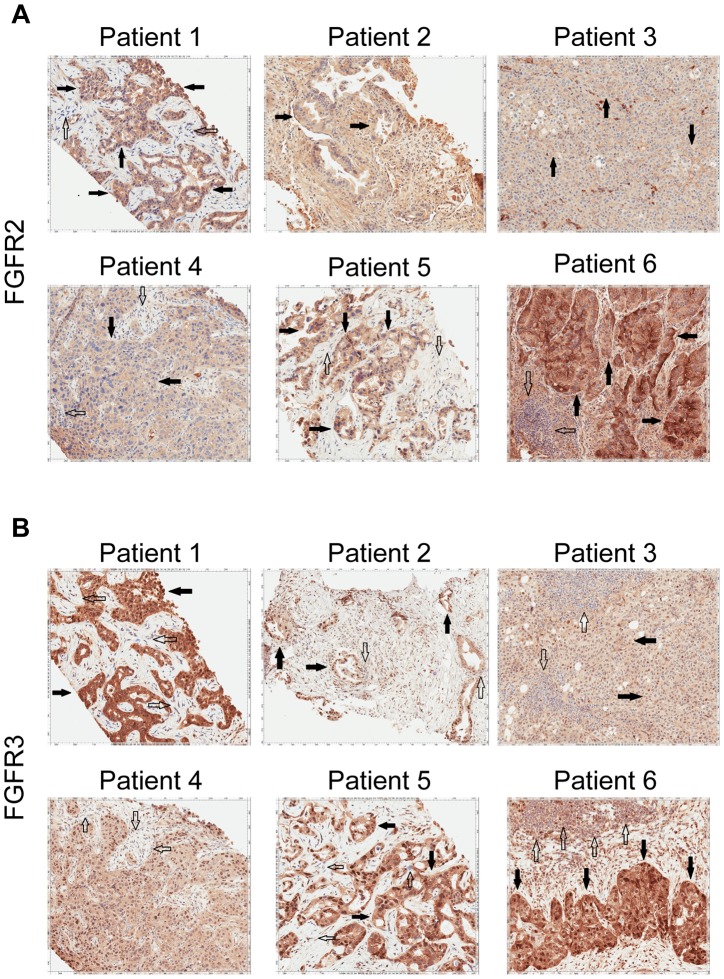
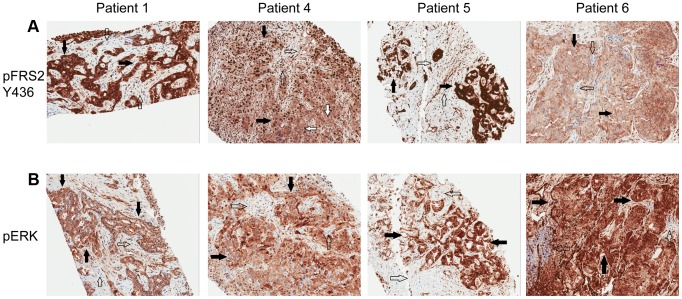
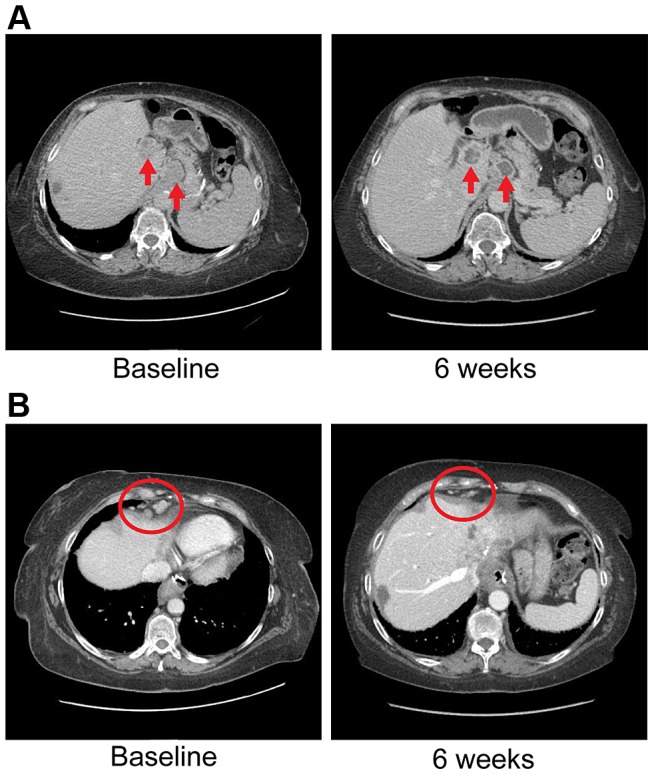
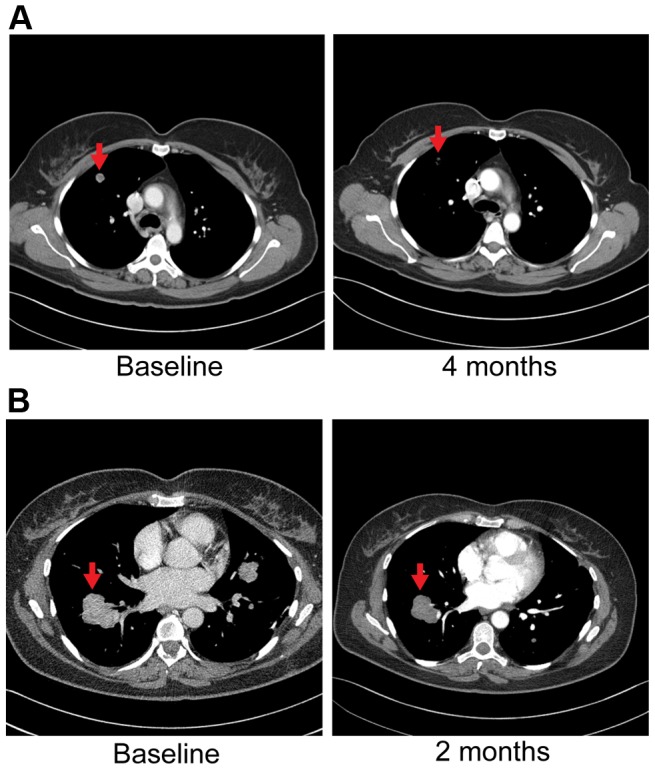
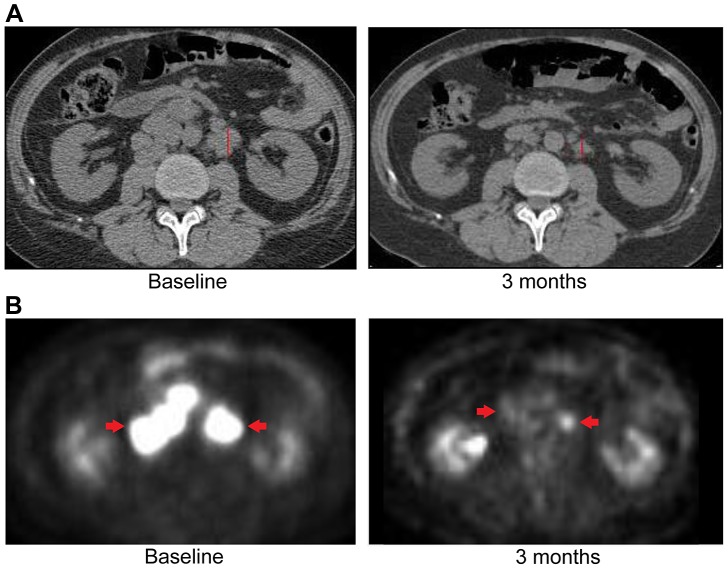
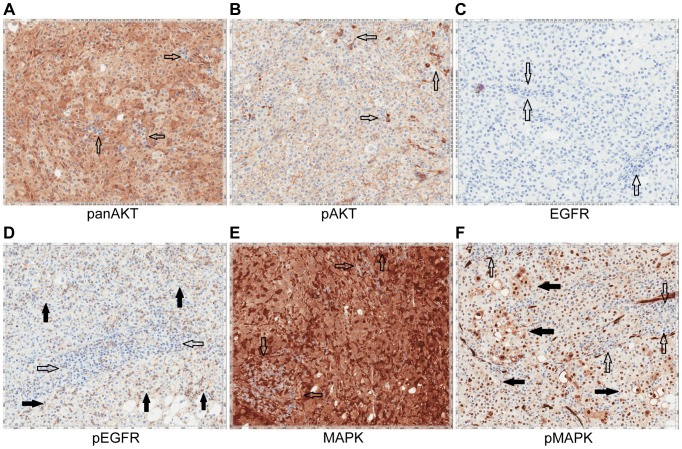
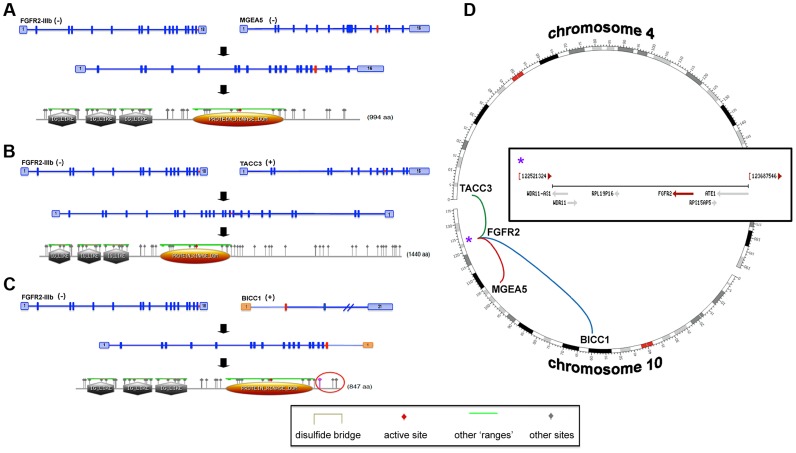
Advanced cholangiocarcinoma continues to harbor a difficult prognosis and therapeutic options have been limited. During the course of a clinical trial of whole genomic sequencing seeking druggable targets, we examined six patients with advanced cholangiocarcinoma. Integrated genome-wide and whole transcriptome sequence analyses were performed on tumors from six patients with advanced, sporadic intrahepatic cholangiocarcinoma (SIC) to identify potential therapeutically actionable events. Among the somatic events captured in our analysis, we uncovered two novel therapeutically relevant genomic contexts that when acted upon, resulted in preliminary evidence of anti-tumor activity. Genome-wide structural analysis of sequence data revealed recurrent translocation events involving the FGFR2 locus in three of six assessed patients. These observations and supporting evidence triggered the use of FGFR inhibitors in these patients. In one example, preliminary anti-tumor activity of pazopanib (in vitro FGFR2 IC50≈350 nM) was noted in a patient with an FGFR2-TACC3 fusion. After progression on pazopanib, the same patient also had stable disease on ponatinib, a pan-FGFR inhibitor (in vitro, FGFR2 IC50≈8 nM). In an independent non-FGFR2 translocation patient, exome and transcriptome analysis revealed an allele specific somatic nonsense mutation (E384X) in ERRFI1, a direct negative regulator of EGFR activation. Rapid and robust disease regression was noted in this ERRFI1 inactivated tumor when treated with erlotinib, an EGFR kinase inhibitor. FGFR2 fusions and ERRFI mutations may represent novel targets in sporadic intrahepatic cholangiocarcinoma and trials should be characterized in larger cohorts of patients with these aberrations.


Conflict of interest statement

Dr. Kipp received grant funding from Abbott Molecular Inc, the suppliers of the FGFR2 FISH probe used in this study. The other authors have no conflicts to declare.

Figures

Figure 1
Figure 1. Sequence variation effects.
Functional effects of high confidence sequence variations for all of the patients were identified as described in the Methods. The abundance of variations in each functional category is provided as percentages relative to the total number of high confidence variations and raw counts are provided in Table 1 . For categories where the percentage was less than 5%, values are not shown. Summaries by individual patients are shown as follows: A) Patient 1, B) Patient 2, C) Patient 3, D) Patient 4, E) Patient 5, and F) Patient 6. Nonsynonymous single nucleotide variations were the predominant class in all of the patients. Two patients, Patients 1 and 2 also accumulated a high number of synonymous mutations in comparison to the other patients; Patient 5 carries the most stops gained likely contributing to a higher number of pseudogenes in comparison to the others; Patient 5 was also the only patient to carry several predicted high impact mutations that affect the splice site acceptor regions (light green, percentage <5%). In addition to the major functional classes summarized, Patient 6 also carried a codon change plus insertion variation.
Figure 2
Figure 2. Representative fluorescent in situ hybridization (FISH) demonstrating the presence of FGFR2 fusion.
A) Cholangiocarcinoma with FGFR2 rearrangement (distinct orange and green signals are present in most of the cells). B) Cholangiocarcinoma negative for FGFR2 rearrangement (orange and green signals remain fused).
Figure 3
Figure 3. Gene Ontology pathway analysis.
Genes carrying single nucleotide or frameshift variations, or aberrant in copy number were annotated and clustered by GO term functional classes, some of which are known to play a role in Cancer (Tables S2 and S3). Major classes for A) SNVs and B) CNVs are labeled in the figure. Proteins predicted to be integral to the membrane and involved in transport, as well as transcriptional regulators were among the most abundant class in all of the patients affected by small scale sequence variations and copy number variations. Variations specifically affecting the EGFR or FGFR gene families were prevalent in Patients 4, 5, and 6 and are highlighted in the figure with the gene name provided in parenthesis next to the pathway name.
Figure 4
Figure 4. Copy number changes and structural rearrangements.
Whole genome data was utilized to determine copy number alterations and structural rearrangements in the genome for Patients 1–5. WGS was not conducted for patient 6. Red indicates copy number gain, green copy number loss and blue lines indicate structural rearrangements. Significant variability between samples was observed for both copy number changes and structural rearrangements. Patient 5 presented with numerous copy number changes and structural rearrangements contrasting with patient 4 who had minimal structural rearrangements and much smaller regions of copy number changes. Patient 3 is characterized by a large number of structural rearrangements with almost no copy number alterations; in contrast, Patient 1 has a moderate number of structural variations, but has large regions of copy number gain and loss. Patient 2 has a moderate number of structural rearrangements with multiple focal amplifications across the genome.
Figure 5
Figure 5. Immunohistochemistry demonstrating FGFR2 and FGFR3 expression.
A) Tumor stained with FGFR2 antibody. Patient 1 demonstrates moderate cytoplasmic positivity (solid arrows); background fibro-inflammatory tissue is negative (empty arrows). Patient 2 demonstrates moderate cytoplasmic expression for FGFR2; tumor nuclei are negative. Patient 3 demonstrates tumor cells with negative nuclear and weak cytoplasmic expression of FGFR2 (solid arrows) with cells demonstrating moderate basolateral or complete membranous staining as well. Patient 4 demonstrates weak/moderate cytoplasmic positivity with multi-focal weak/moderate membranous expression (solid arrows); background fibro-inflammatory tissue demonstrates negative/weak staining (empty arrows). Patient 5 demonstrates weak/moderate cytoplasmic positivity with multi-focal moderate/strong membranous expression (solid arrows); background fibro-inflammatory tissue is negative (empty arrows). Patient 6 demonstrates moderate/strong cytoplasmic positivity (solid arrows); background lymphocytes are negative (empty arrows). B) Tumor stained with FGFR3 antibody. Patient 1 demonstrates strong cytoplasmic positivity, variable nuclear expression and occasional moderate/strong membranous expression (solid arrows); background fibrous tissue is negative (empty arrows). Patient 2 demonstrates negatively staining background neutrophils (focally intraepithelial-far right) (empty arrows) and tumor cells with strong nuclear expression and moderate cytoplasmic positivity (solid arrows). Patient 3 demonstrates negatively staining background inflammation (empty arrows) and tumor cells with weak nuclear expression and moderate cytoplasmic positivity (solid arrows). Patient 4 demonstrates weak/moderate cytoplasmic positivity and variable nuclear expression; background fibro-inflammatory tissue demonstrates negative/weak positivity (empty arrows). Patient 5 demonstrates moderate cytoplasmic positivity, variable nuclear expression and strong multi-focal membranous expression (solid arrows); background fibrous tissue is negative. Patient 6 demonstrates diffuse/moderate/strong cytoplasmic and membranous positivity and variable nuclear expression (solid arrows); background lymphocytes are negative (empty arrows).
Figure 6
Figure 6. Immunohistochemistry demonstrating pFRS2 Y436, and pERK expression in Patients 1, 4, 5 and 6.
A) Tumor stained with pFRS2 Y436 antibody. Patient 1 tumor cells demonstrating both strong cytoplasmic and nuclear expression of pFRS2 (solid arrows); background fibrous stroma is negative (empty arrows). Patient 4 tumor cells show strong nuclear expression and moderate to strong cytoplasmic positivity (solid arrows); occasional background fibrous stromal cells are negative for pFRS2 (empty arrows) and scattered tumor cells show basolateral/membranous staining as well (white arrows). Patient 5 tumor cells show intensely strong expression in both nuclei and cytoplasm (solid arrows); scattered background fibrous stromal cells are negative (empty arrows). Patient 6 tumor cells show negative nuclear expression of pFRS2, moderate cytoplasmic expression and basolateral or membranous expression of varying intensity (solid arrows); background fibrous stromal cells are negative (empty arrows). B) Tumor stained with pERK(MAPK) antibody. Patient 1 demonstrates negative/weak fibrous stroma (empty arrows) and tumor cells with negative nuclei and moderate to strong cytoplasmic expression (solid arrows). Patient 4 demonstrates negative inflammatory background (empty arrows) tumor cells with variable negative to strong nuclear expression and moderate to strong cytoplasmic positivity (solid arrows). Patient 5 demonstrates negative/weak fibrous stroma (empty arrows) and tumor cells with strong nuclear and cytoplasmic expression (solid arrows). Patient 6 demonstrates negative background lymphocytes/mononuclear inflammatory cells (empty arrows) and tumor cells with strong nuclear and cytoplasmic expression (solid arrows).
Figure 7
Figure 7. Anti-tumor activity in Patient 4 harboring an FGFR2-MGEA5 fusion, to FGFR inhibitors.
A) CT images of patient 4, whose tumor possessed an FGFR2-MGEA5 fusion, at baseline and 6 weeks demonstrate central necrosis of a caudate liver lobe mass (left arrow), 2.6 cm at baseline and 6 weeks, and shrinkage of a metastatic supraceliac axis lymph node (right arrow), 3.1 cm and 2.9 cm at baseline and 6 weeks respectively. B) CT images of patient 4 showing shrinkage of metastatic lymph nodes involving the right cardiophrenic angle (red circles), 1.3 cm and 0.5 cm at baseline and 6 weeks respectively.
Figure 8
Figure 8. Anti-tumor activity in Patient 6, harboring an FGFR2-TACC3 fusion, to FGFR inhibitors.
A) CT images of patient 6, whose tumor possessed an FGFR2-TACC3 fusion, at baseline and after four months of pazopanib demonstrate significant tumor shrinkage (red arrows), 10.8 mm and 3.1 mm respectively. B) CT images of patient 6 at baseline and two months demonstrate significant tumor shrinkage (red arrows), 41.1 mm and 39.4 mm respectively after subsequent ponatinib treatment, 45 mg/daily, was begun.
Figure 9
Figure 9. Anti-tumor activity of Patient 3, harboring an ERRFI1 mutation, to erlotinib, an EGFR inhibitor.
A) CT images of patient 3 at baseline and three months demonstrate significant tumor shrinkage (red marks). CT demonstrates right retroperitoneal lymph nodes decreasing from 7.6 cm to 2.9 cm and left retroperitoneal lymph nodes decreasing from 3.3 cm to 1.7 cm. B) PET images of patient 3 at baseline and three months demonstrate significant tumor shrinkage (red arrows). Hypermetabolic areas corresponding to right retroperitoneal lymph nodes demonstrate decrease from 8 cm longest diameter to imperceptible and left retroperitoneal lymph nodes decreasing from 4.2 cm to 1.4 cm. Both regions demonstrated significant reduction in metabolic activity.
Figure 10
Figure 10. Immunohistochemistry of Patient 3's tumor demonstrating activation of the EGFR pathway.
A) Tumor stained with panAKT demonstrating diffuse cytoplasmic positivity with negative background lymphocytes (empty arrows). B) Tumor stained with pAKT demonstrating diffuse membranous staining and negative cytoplasmic expression; scattered background inflammatory cells showing strong cytoplasmic staining (empty arrows). C) Tumor stained with EGFR. Tumor cells are EGFR negative with background lymphocytes also negative (empty arrows). D) Tumor stained with pEGFR showing membranous positivity (solid arrows) with negative background lymphocytes (empty arrows). E) Tumor stained with MAPK/ERK1/2 demonstrating moderate to strong cytoplasmic staining of total MAPK with negative background lymphocytes (empty arrows). F) Tumor stained with pMAPK/pERK demonstrating increased expression compared to the negative background lymphocytes (empty arrows).
Figure 11
Figure 11. FGFR2-IIIb fusion events.
Transcripts and hypothetical protein products are modeled to illustrate the potential functional impact of fusion events involving FGFR2 (A–C). The identified fusion events involving MGEA5 (patient 4) (A) and BICC1 (patient 5, reciprocal event) (C) are chromosome 10 intrachromosomal (D). In addition, patient 6 carried an interchromosomal fusion event (D) involving FGFR2 and TACC3 (B). The FGFR2 gene encodes for several isoforms with eleven representative transcripts and patients 4, 5, and 6 carry fusions involving the epithelial cell specific transcript isoform (FGFR2-IIIb). All identified fusion breakpoints are close in proximity and are predicted to occur within the last intron of the transcript and terminal to a known protein tyrosine kinase domain (A–C, gold domain). Predicted “Other” sites for all of the fusion protein models are the same and include the following: Casein kinase II phosphorylation sites, N-glycosylation sites, Protein kinase C phosphorylation sites, N-myristoylation sites, Tyrosine kinase phosphorylation sites, and cAMP-/cGMP-dependent protein kinase phosphorylation sites (A–C, grey triangle annotations). In all cases, fusions result in a predicted expansion of Casein kinase II phosphorylation and Protein kinase C phosphorylation sites. A protein product model is shown only for one of the reciprocal events involving the FGFR2 and BICC1 genes (FGFR2BICC1, C). The fusion breakpoints of the reciprocal events effect Exons 1 and 2 of the BICC1 gene, which translates to a difference of a predicted phosphoserine site within the Casein kinase II phosphorylation region (C, purple triangle within red circle). The FGFR2 gene is located within a fragile site region (FRA10F) and is flanked by two ribosomal protein pseudogenes, RPS15AP5 and RPL19P16 (see D inset (*)), whose repetitive sequence content may also contribute to genomic instability at the FGFR2 initiation site.

References

    1. Shin HR, Lee CU, Park HJ, Seol SY, Chung JM, et al. (1996) Hepatitis B and C virus, Clonorchis sinensis for the risk of liver cancer: a case-control study in Pusan, Korea. International journal of epidemiology 25: 933–940. - PubMed
    1. Watanapa P (1996) Cholangiocarcinoma in patients with opisthorchiasis. The British journal of surgery 83: 1062–1064. - PubMed
    1. Watanapa P, Watanapa WB (2002) Liver fluke-associated cholangiocarcinoma. The British journal of surgery 89: 962–970. - PubMed
    1. Bergquist A, Ekbom A, Olsson R, Kornfeldt D, Loof L, et al. (2002) Hepatic and extrahepatic malignancies in primary sclerosing cholangitis. Journal of hepatology 36: 321–327. - PubMed
    1. Bergquist A, Glaumann H, Persson B, Broome U (1998) Risk factors and clinical presentation of hepatobiliary carcinoma in patients with primary sclerosing cholangitis: a case-control study. Hepatology 27: 311–316. - PubMed

MeSH terms