. 2014 Feb 13;10(2):e1004137.
doi: 10.1371/journal.pgen.1004137. eCollection 2014 Feb.

Accurate and robust genomic prediction of celiac disease using statistical learning

Affiliations

Accurate and robust genomic prediction of celiac disease using statistical learning

Gad Abraham et al. PLoS Genet. .

Erratum in

  • PLoS Genet. 2014 Apr;10(4):e1004374

Abstract

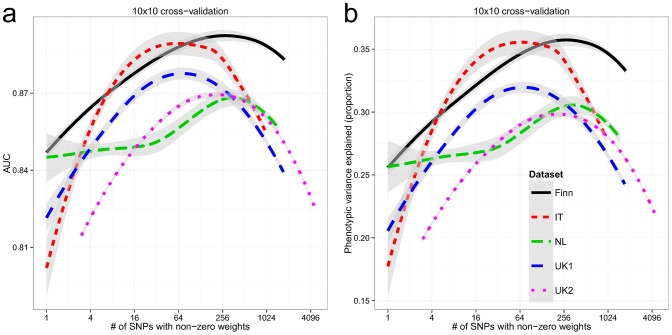
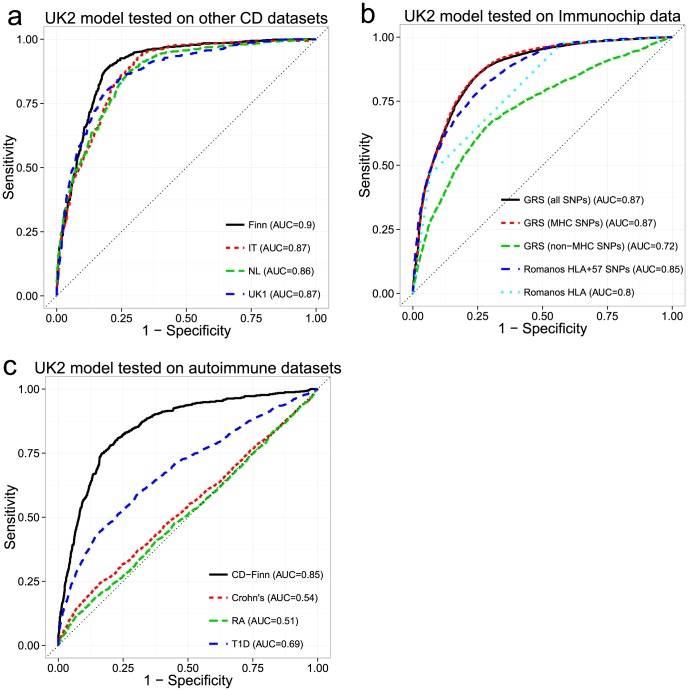
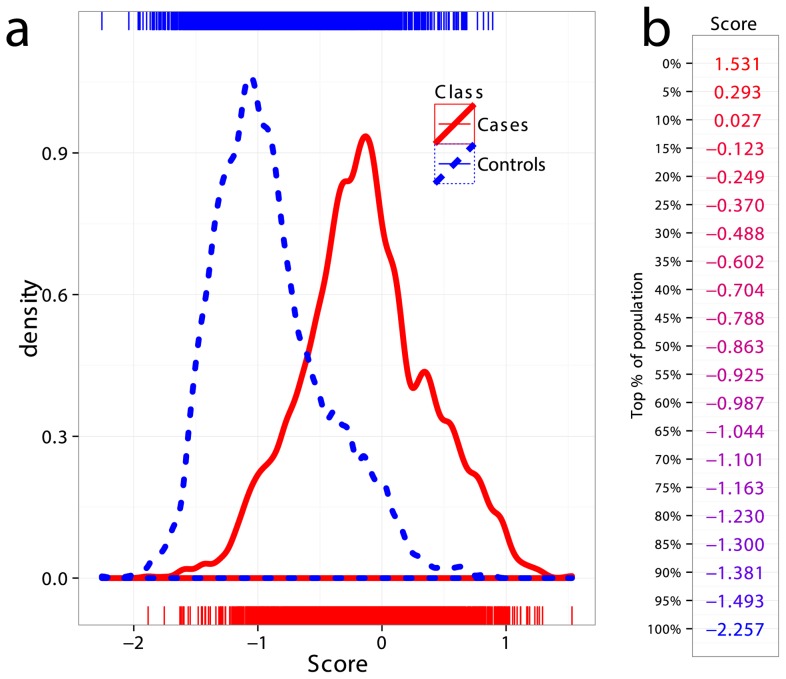
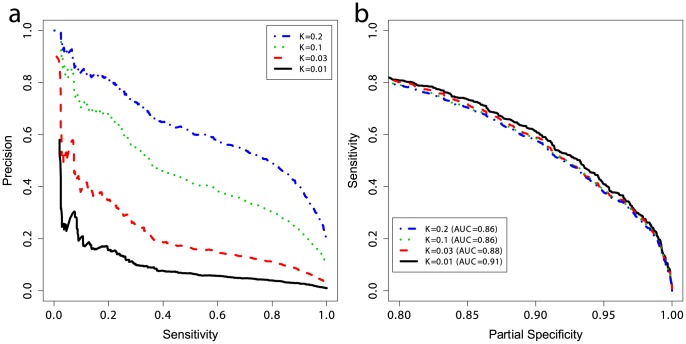
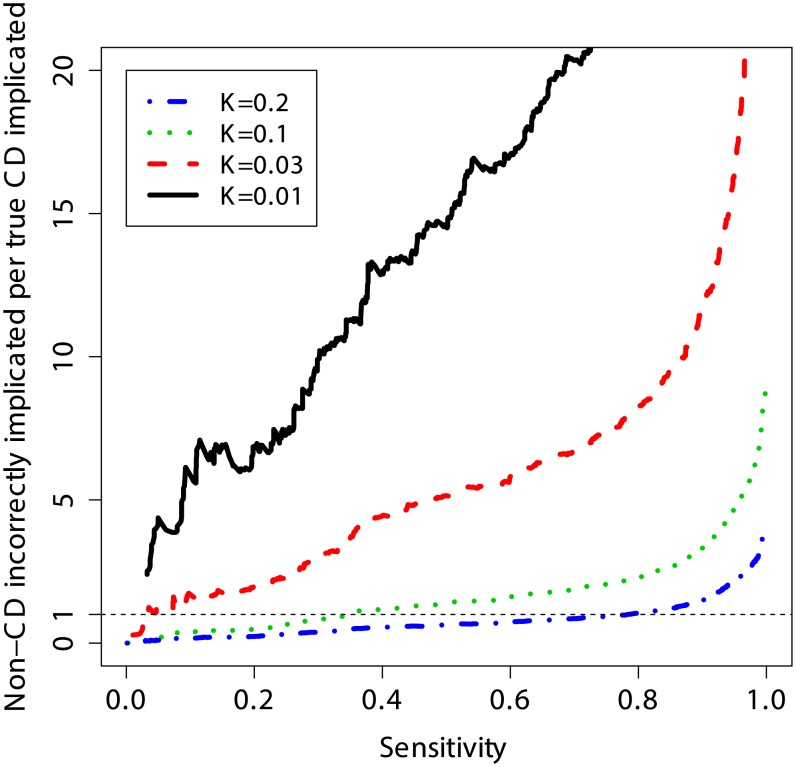
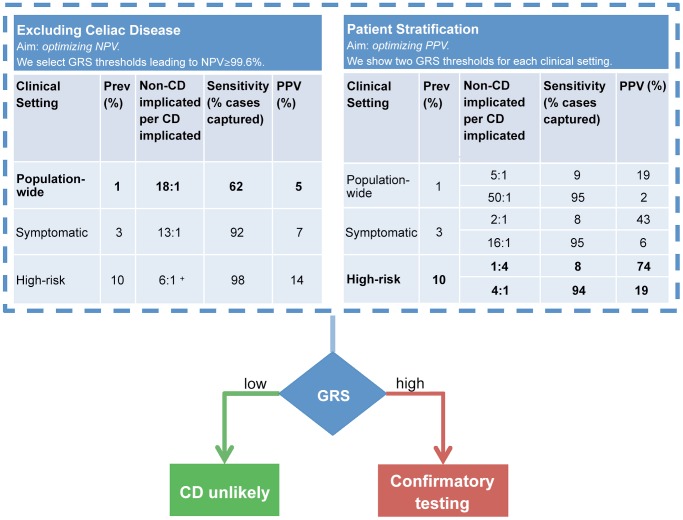
Practical application of genomic-based risk stratification to clinical diagnosis is appealing yet performance varies widely depending on the disease and genomic risk score (GRS) method. Celiac disease (CD), a common immune-mediated illness, is strongly genetically determined and requires specific HLA haplotypes. HLA testing can exclude diagnosis but has low specificity, providing little information suitable for clinical risk stratification. Using six European cohorts, we provide a proof-of-concept that statistical learning approaches which simultaneously model all SNPs can generate robust and highly accurate predictive models of CD based on genome-wide SNP profiles. The high predictive capacity replicated both in cross-validation within each cohort (AUC of 0.87-0.89) and in independent replication across cohorts (AUC of 0.86-0.9), despite differences in ethnicity. The models explained 30-35% of disease variance and up to ∼43% of heritability. The GRS's utility was assessed in different clinically relevant settings. Comparable to HLA typing, the GRS can be used to identify individuals without CD with ≥99.6% negative predictive value however, unlike HLA typing, fine-scale stratification of individuals into categories of higher-risk for CD can identify those that would benefit from more invasive and costly definitive testing. The GRS is flexible and its performance can be adapted to the clinical situation by adjusting the threshold cut-off. Despite explaining a minority of disease heritability, our findings indicate a genomic risk score provides clinically relevant information to improve upon current diagnostic pathways for CD and support further studies evaluating the clinical utility of this approach in CD and other complex diseases.


Conflict of interest statement

The authors have declared that no competing interests exist.

Figures

Figure 1
Figure 1. The analysis workflow.
Figure 2
Figure 2. Building genomic models predictive of celiac disease.
LOESS-smoothed (a) AUC and (b) phenotypic variance explained, from 10×10 cross-validation, with differing model sizes, within each celiac dataset. The grey bands represent 95% confidence intervals about the mean LOESS smooth.
Figure 3
Figure 3. Performance of the genomic risk score in external validation, when compared to other approaches, and on other related diseases.
ROC curves for models trained in the UK2 dataset and tested on (a) four other CD datasets, (b) the Immunochip CD dataset, comparing the GRS approach with that of Romanos et al. , and (c) three other autoimmune diseases (Crohn's disease, Rheumatoid Arthritis, and Type 1 Diabetes). We did not re-tune the models on the test data. For (b) and (c), we used a reduced set of SNPs for training, from the intersection of the UK2 SNPs with the Immunochip or WTCCC SNPs (18,252 SNPs and 76,847 SNPs, respectively). In (c), the same reduced set of SNPs was used for the CD-Finn dataset, in order to maintain the same SNPs across all target datasets.
Figure 4
Figure 4. Distribution of genomic risk scores in cases and controls.
(a) Kernel density estimates of the risk scores predicted using models on UK2 and tested in the combined dataset Finn+NL+IT, for cases and controls. (b) Thresholds for risk scores in terms of population percent, with the top more likely to be a CD and the bottom more likely to be non-CD.
Figure 5
Figure 5. Performance at different prevalences and partial ROC curves.
(a) Positive and negative predictive values and (b) partial ROC curves for models trained on UK2 using 228 SNPs in the model, and tested on the combined Finn+NL+IT dataset. K represents the prevalence of disease in the dataset and the curves are threshold-averaged over 50 replications. Note that precision is not a monotonic function of the risk score. Precision is equivalent to PPV here. A prevalence of ∼10% corresponds to prevalence in first-degree relatives of probands with CD .
Figure 6
Figure 6. Clinical interpretation as a function of threshold and prevalence.
The number of non-CD cases “misdiagnosed” (wrongly implicated by GRS) per true CD cases “diagnosed” (correctly implicated by GRS), for different levels of sensitivity. The risk score is based on a model trained on the UK2 dataset, and tested on the combined Finn+NL+IT dataset. The results were threshold-averaged over 50 independent replications. Note that the curve for K = 1% does not span the entire range due to averaging over a small number of cases in that dataset.
Figure 7
Figure 7. Example clinical scenarios.
The GRS can be employed in different clinical scenarios and tuned to optimize outcomes. The GRS can be employed in a comparable manner to HLA testing (left table) to confidently exclude CD. In this scenario, we selected a GRS threshold based on NPV = 99.6% however a range of thresholds can be selected to achieve a high NPV (see note below). The GRS can also stratify CD risk (right table). Confirmatory testing (such as small bowel biopsy) would be reserved for those at high-risk. In this example, we present two scenarios: optimization of PPV or of sensitivity. In comparison to the GRS, all HLA-susceptible patients will need to undergo further confirmatory testing for CD. For more information on GRS performance across a range of thresholds, see Table S2. Prospective validation of the GRS in local populations would enable the most appropriate settings for NPV, PPV and sensitivity to be identified which provide the optimal diagnostic outcomes. + The highest achievable NPV at 10% prevalence was 99.4%.

References

    1. Anderson RP (2011) Coeliac disease is on the rise. Med J Aust 194: 278–279. - PubMed
    1. Green PH, Cellier C (2007) Celiac disease. N Engl J Med 357: 1731–1743. - PubMed
    1. Catassi C, Kryszak D, Louis-Jacques O, Duerksen DR, Hill I, et al. (2007) Detection of Celiac disease in primary care: a multicenter case-finding study in North America. Am J Gastroenterol 102: 1454–1460. - PubMed
    1. Dube C, Rostom A, Sy R, Cranney A, Saloojee N, et al. (2005) The prevalence of celiac disease in average-risk and at-risk Western European populations: a systematic review. Gastroenterology 128: S57–67. - PubMed
    1. Anderson RP, Henry MJ, Taylor R, Duncan EL, Danoy P, et al. (2013) A novel serogenetic approach determines the community prevalence of celiac disease and informs improved diagnostic pathways. BMC Med 11: 188. - PMC - PubMed

Publication types