. 2014 Feb 4:8:4.
doi: 10.3389/fnsys.2014.00004. eCollection 2014.

Back to front: cerebellar connections and interactions with the prefrontal cortex

Affiliations

Back to front: cerebellar connections and interactions with the prefrontal cortex

Thomas C Watson et al. Front Syst Neurosci. .

Abstract

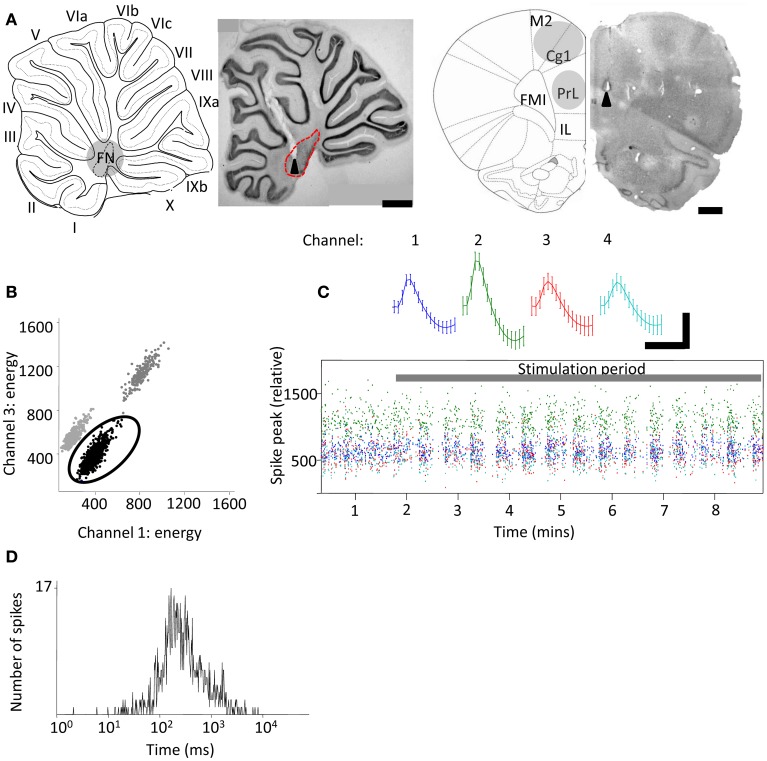
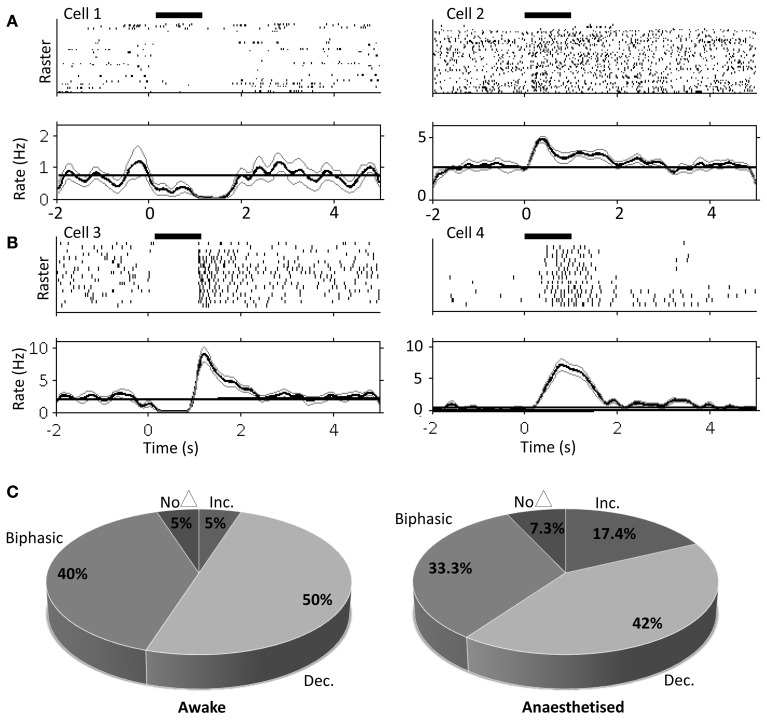
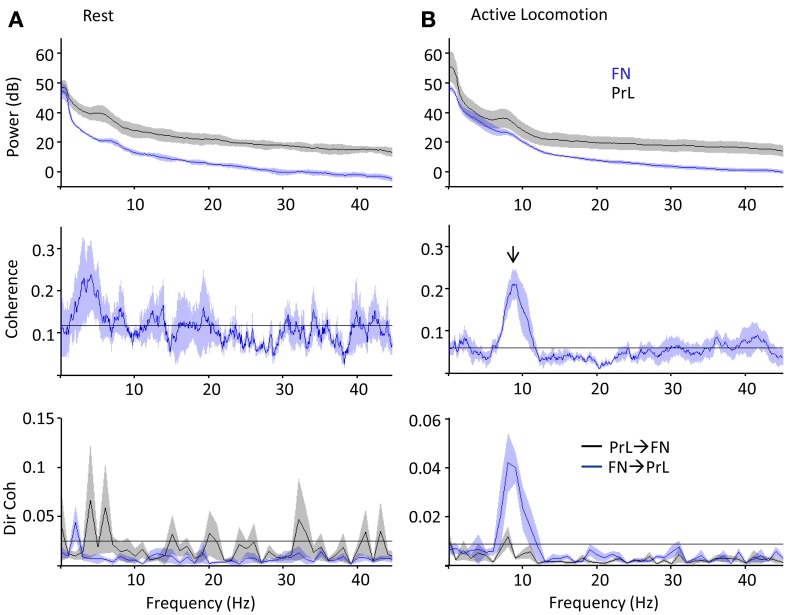
Although recent neuroanatomical evidence has demonstrated closed-loop connectivity between prefrontal cortex and the cerebellum, the physiology of cerebello-cerebral circuits and the extent to which cerebellar output modulates neuronal activity in neocortex during behavior remain relatively unexplored. We show that electrical stimulation of the contralateral cerebellar fastigial nucleus (FN) in awake, behaving rats evokes distinct local field potential (LFP) responses (onset latency ~13 ms) in the prelimbic (PrL) subdivision of the medial prefrontal cortex. Trains of FN stimulation evoke heterogeneous patterns of response in putative pyramidal cells in frontal and prefrontal regions in both urethane-anesthetized and awake, behaving rats. However, the majority of cells showed decreased firing rates during stimulation and subsequent rebound increases; more than 90% of cells showed significant changes in response. Simultaneous recording of on-going LFP activity from FN and PrL while rats were at rest or actively exploring an open field arena revealed significant network coherence restricted to the theta frequency range (5-10 Hz). Granger causality analysis indicated that this coherence was significantly directed from cerebellum to PrL during active locomotion. Our results demonstrate the presence of a cerebello-prefrontal pathway in rat and reveal behaviorally dependent coordinated network activity between the two structures, which could facilitate transfer of sensorimotor information into ongoing neocortical processing during goal directed behaviors.

Keywords: cerebellum; coherence; fastigial nucleus; prefrontal cortex; prelimbic cortex; theta.


Figures

Figure 1
Figure 1
Extracellular tetrode recordings of single-unit PrL activity during cerebellar stimulation. (A) Grouped schematic (shaded gray areas, adapted from Paxinos and Watson, 2006) and representative micrographs of neutral red-stained 50 μm saggital and transverse brain slices showing respectively the sites of electrolytic lesions (arrowheads) in the cerebellum (left,) and PrL, right). Dashed lines indicate outline of fastigial nucleus and overlying cerebellar cortical lobules are numbered; scale bars, 1 mm. M2, supplementary motor cortex; Cg1, cingulate cortex; IL, infralimbic cortex. FMI, forceps minor of the corpus callosum. (B) Three clusters of action potentials spread along the axes of relative energy recorded on two channels of a tetrode in PrL. The properties of the black cluster (circled) are shown in (C,D). (C) Mean waveform recorded on color-coded channels of the tetrode (top) showing stable relative spike amplitudes throughout one experiment (bottom) (scale bar, 0.05 mV; 0.7 ms). (D), Distribution of interspike intervals (ISI) for all spikes fired by the unit in the experimental session.
Figure 2
Figure 2
Evoked field potentials in the frontal cortex following FN stimulation in behaving rats. (A) Example experiment illustrating averaged (thick black line) field potentials (72 trials) recorded from tetrodes at different depths in the frontal cortex following stimulation of the FN (recording positions indicated by numbers on rat brain schematic adapted from Paxinos and Watson (2006); small arrowheads indicate timing of FN stimulation artefacts; M2, supplementary motor cortex; Cg1, cingulate cortex; IL, infralimbic cortex. FMI, forceps minor of the corpus callosum); scale bars, 1 mm and 0.1 mV, 20 ms, respectively. Thin gray lines idicates s.e.m. Arrow indicates field potential peak. (B) Grouped field potential peak-to-trough amplitudes expressed as a percentage of the maximal reponse size at superficial (1.3–2 mm) and intermediate (2.6–3 mm) and ventral (3.1–3.5 mm) recording positions (*P < 0.05; One-Way ANOVA with Tukey's multiple comparison test; n = 4; each data point calculated from 72 trials per animal).
Figure 3
Figure 3
Single unit PrL responses following FN stimulation in awake and urethane anesthetized rats. Raster and peri-stimulus rate plots for example cells recorded in PrL in the awake animal, cells 1 and 2 (A) and urethane anesthetized animal, cells 3 and 4 (B). Horizontal black bar indicates duration of stimulation (100 μA; 100 Hz; 1s duration); bold line indicates instantaneous mean firing rate; gray lines indicate bootstrapped error estimate; horizontal line indicates mean baseline firing rate prestimulation; bin size, 100 ms; 17 trials for anesthetized and 33 trials for awake experiments. (C) Quantification of PrL cell firing patterns following FN stimulation in awake (n = 20 putative pyramidal cells from 3 animals) and anesthetized rats (n = 69 putative pyramidal cells from 8 animals).
Figure 4
Figure 4
Slow-wave modulation of PrL activity is disrupted by FN stimulation in urethane anesthetized rats. Cross- and auto-correlogram plots (40 ms bins, calculated over 2 s pre/post-stimulation) of all possible PrL cell pair combinations (n = 69 cells, 8 rats) during non-stimulated (thin line) and FN stimulation (thick black line) states in urethane anesthetized rats. **P < 0.01, paired t-test. Note attenuation of slow-wave periodicity during FN stimulation also reported in anesthetized cat (Steriade, 1995).
Figure 5
Figure 5
PrL-FN LFP network activity during rest and open field exploration. Grouped power spectra (top panel; cerebellum/FN in blue, prelimbic cortex/PrL in black), coherence (middle panel) and directed coherence (Dir coh, bottom panel; FN-PrL direction in blue, PrL-FN in black) as rats sat quietly on rest platform (A, n = 5) or actively moved in the open field arena (B, 1 Hz bandwidth; n = 4). Confidence level at P = 0.05 marked by horizontal black lines, shading indicates jack-knife error bars. Arrow indicates significant coherence peak at theta frequency, which was only during active locomotion and preferentially driven in the FN-PrL direction.

References

    1. Allen G., McColl R., Barnard H., Ringe W. K., Fleckenstein J., Cullum C. M. (2005). Magnetic resonance imaging of cerebellar-prefrontal and cerebellar-parietal functional connectivity. Neuroimage 28, 39–48 10.1016/j.neuroimage.2005.06.013 - DOI - PubMed
    1. Andreasen N. C., O'Leary D. S., Cizadlo T., Arndt S., Rezai K., Ponto L. L., et al. (1996). Schizophrenia and cognitive dysmetria: a positron-emission tomography study of dysfunctional prefrontal-thalamic-cerebellar circuitry. Proc. Natl. Acad. Sci. U.S.A. 93, 9985–9990 10.1073/pnas.93.18.9985 - DOI - PMC - PubMed
    1. Andreasen N. C., Pierson R. (2008). The role of the cerebellum in schizophrenia. Biol. Psychiatry 64, 81–88 10.1016/j.biopsych.2008.01.003 - DOI - PMC - PubMed
    1. Arguello P. A., Enquist L. W., Wang S. S.-H. (2012). Long-distance connectivity between prefrontal cortex and cerebellum in mouse, in Society for Neuroscience (New Orleans: ).
    1. Bagnall M. W., Zingg B., Sakatos A., Moghadam S. H., Zeilhofer H. U., du Lac S. (2009). Glycinergic projection neurons of the cerebellum. J. Neurosci. 29, 10104–10110 10.1523/JNEUROSCI.2087-09.2009 - DOI - PMC - PubMed

LinkOut - more resources