. 2014 Feb 4:7:2.
doi: 10.3389/fneng.2014.00002. eCollection 2014.

Abiotic-biotic characterization of Pt/Ir microelectrode arrays in chronic implants

Affiliations

Abiotic-biotic characterization of Pt/Ir microelectrode arrays in chronic implants

Abhishek Prasad et al. Front Neuroeng. .

Abstract

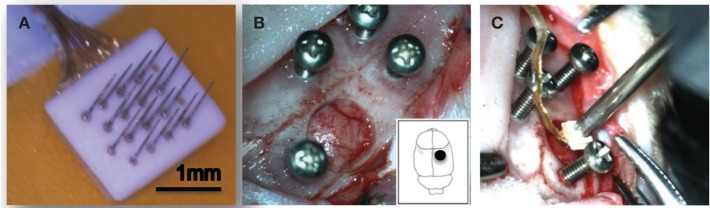
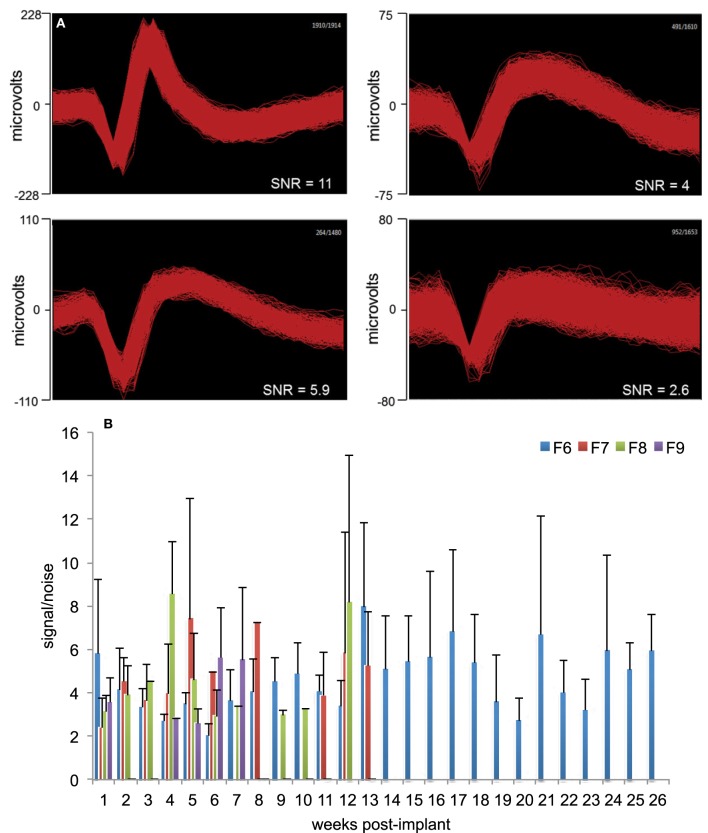
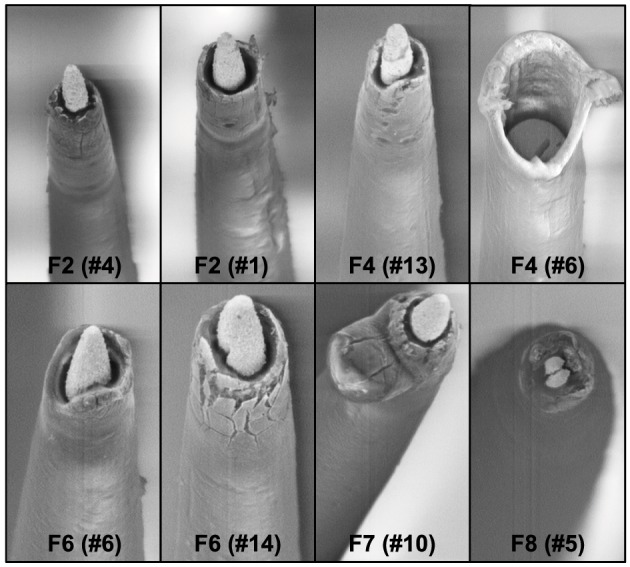
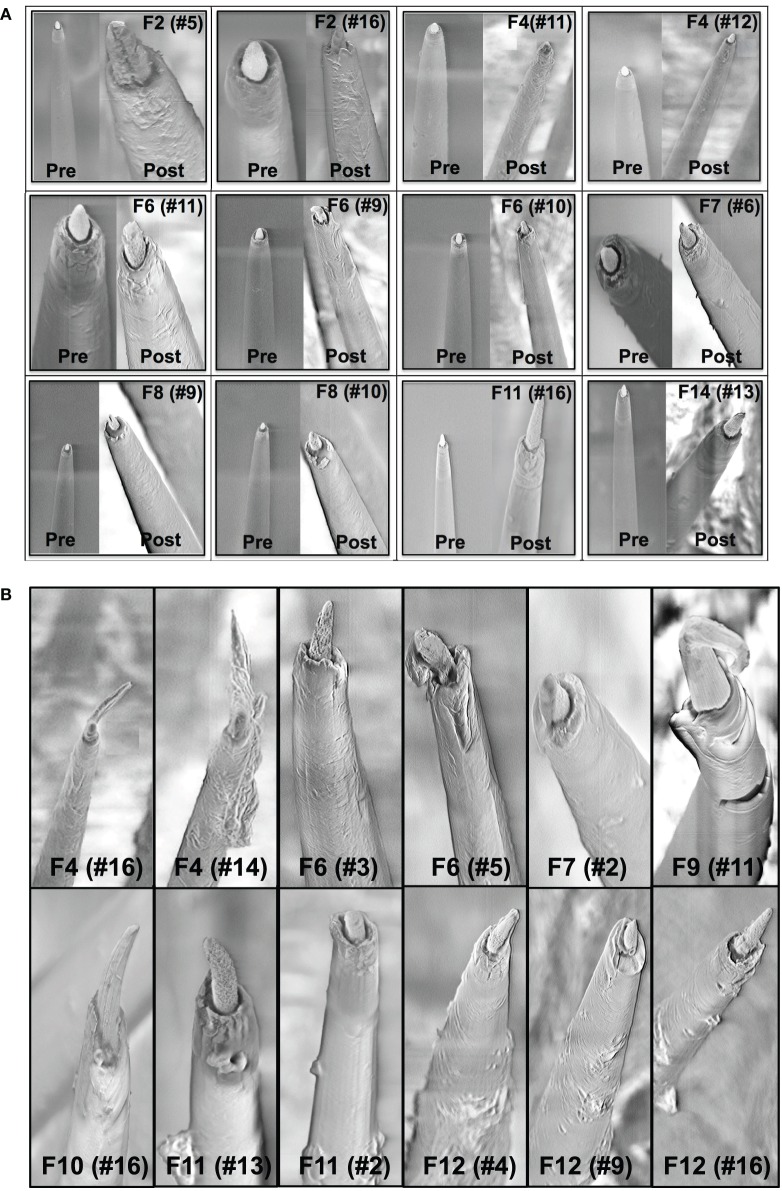
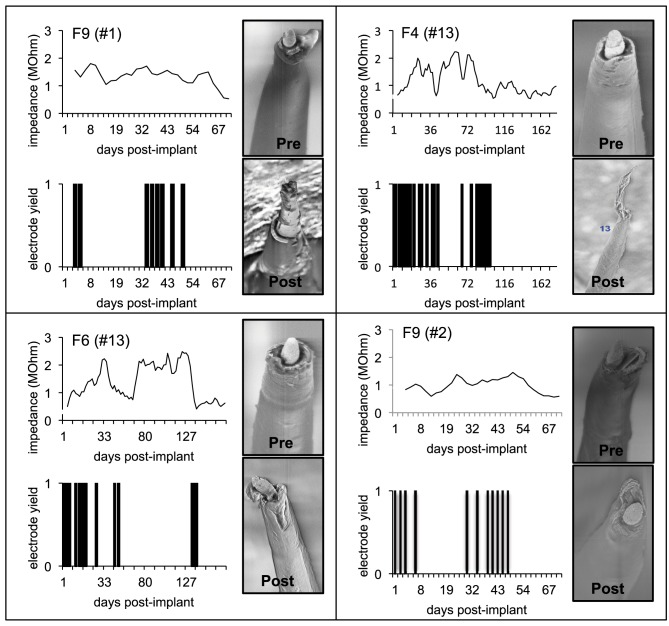
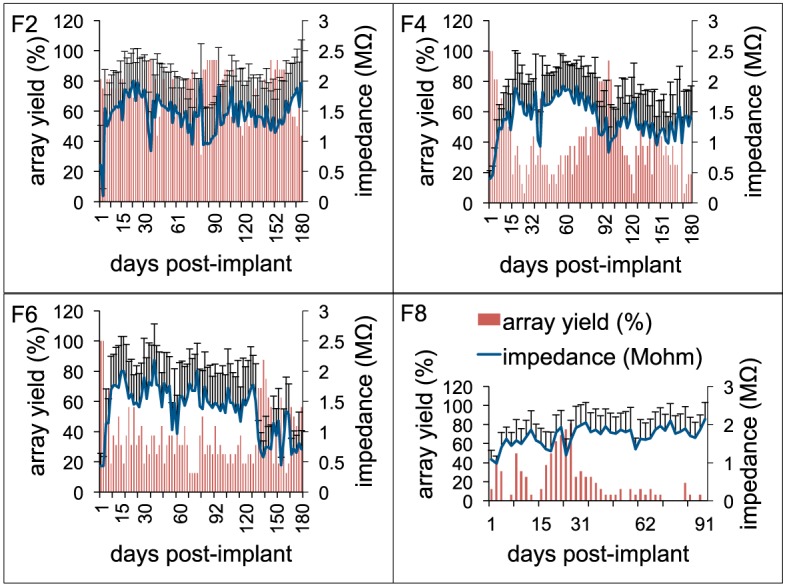
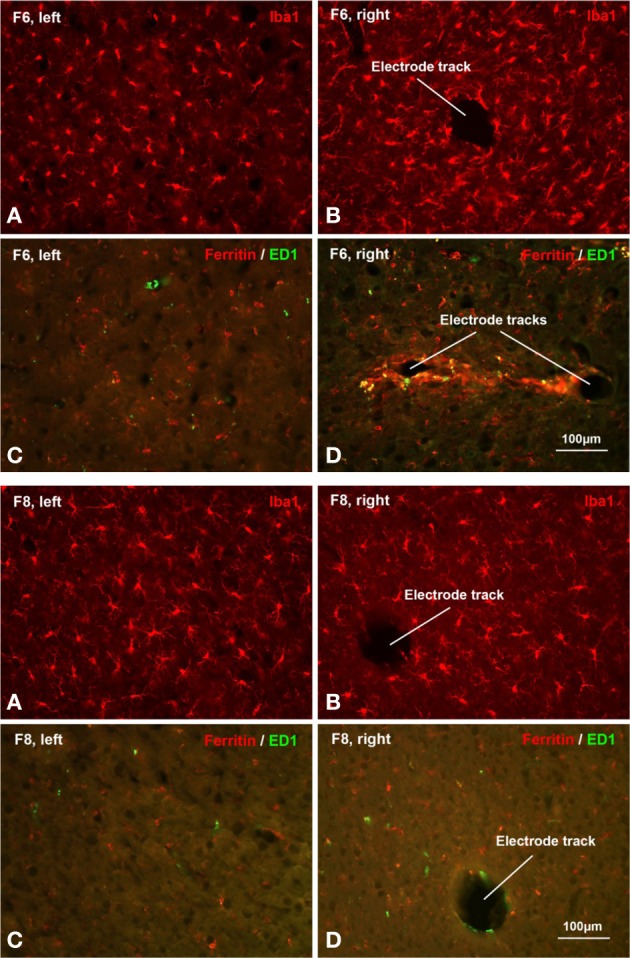
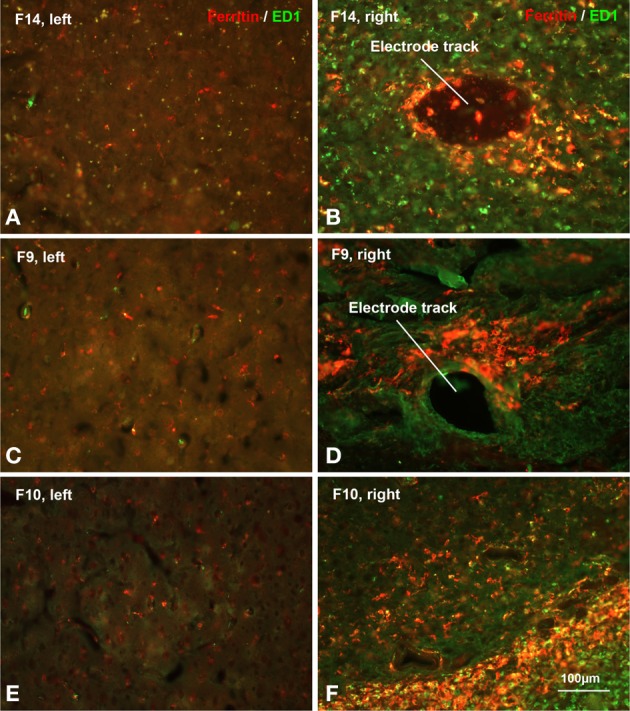
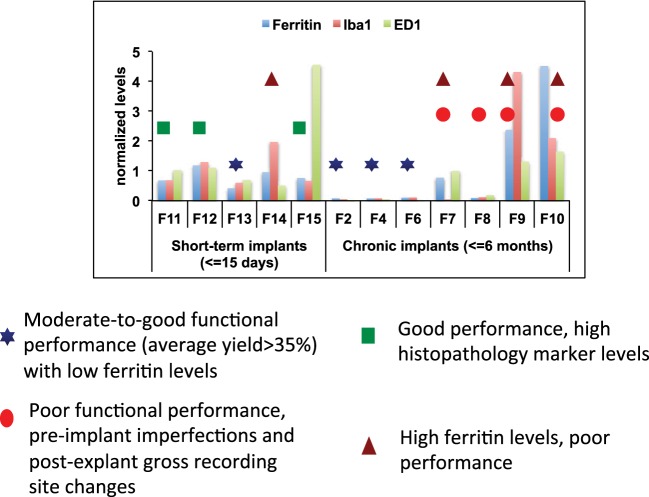
Pt/Ir electrodes have been extensively used in neurophysiology research in recent years as they provide a more inert recording surface as compared to tungsten or stainless steel. While floating microelectrode arrays (FMA) consisting of Pt/Ir electrodes are an option for neuroprosthetic applications, long-term in vivo functional performance characterization of these FMAs is lacking. In this study, we have performed comprehensive abiotic-biotic characterization of Pt/Ir arrays in 12 rats with implant periods ranging from 1 week up to 6 months. Each of the FMAs consisted of 16-channel, 1.5 mm long, and 75 μm diameter microwires with tapered tips that were implanted into the somatosensory cortex. Abiotic characterization included (1) pre-implant and post-explant scanning electron microscopy (SEM) to study recording site changes, insulation delamination and cracking, and (2) chronic in vivo electrode impedance spectroscopy. Biotic characterization included study of microglial responses using a panel of antibodies, such as Iba1, ED1, and anti-ferritin, the latter being indicative of blood-brain barrier (BBB) disruption. Significant structural variation was observed pre-implantation among the arrays in the form of irregular insulation, cracks in insulation/recording surface, and insulation delamination. We observed delamination and cracking of insulation in almost all electrodes post-implantation. These changes altered the electrochemical surface area of the electrodes and resulted in declining impedance over the long-term due to formation of electrical leakage pathways. In general, the decline in impedance corresponded with poor electrode functional performance, which was quantified via electrode yield. Our abiotic results suggest that manufacturing variability and insulation material as an important factor contributing to electrode failure. Biotic results show that electrode performance was not correlated with microglial activation (neuroinflammation) as we were able to observe poor performance in the absence of neuroinflammation, as well as good performance in the presence of neuroinflammation. One biotic change that correlated well with poor electrode performance was intraparenchymal bleeding, which was evident macroscopically in some rats and presented microscopically by intense ferritin immunoreactivity in microglia/macrophages. Thus, we currently consider intraparenchymal bleeding, suboptimal electrode fabrication, and insulation delamination as the major factors contributing toward electrode failure.

Keywords: Pt/Ir microelectrodes; abiotic; biotic; blood brain barrier (BBB); floating microelectrode arrays (FMA); impedance; neural interface; neuroinflammation.


Figures

Figure 1
Figure 1
Experimental setup. A 16-channel Pt/Ir floating microelectrode array (FMA) consisting of 1.5 mm long and 75 μm diameter with tapered microwires tips was used for all implants (A). Surgical implantation procedure in the rat somatosensory cortex is shown (B,C).
Figure 2
Figure 2
Signal quality and SNR. (A) Representative offline sorted waveforms isolated from individual electrodes to depict signal quality. High (>5), medium (3–5), and low SNR (<3) waveforms are shown. In general, SNR values were in the range 3–6. Waveforms are shown within a 1.2 ms time-window. (B) Weekly signal-to-noise levels for animals F6, F7, F8, and F9 are shown. SNR values were comparable to those reported earlier by other studies. SNR values were not dependent upon implant durations or daily changes in impedance values.
Figure 3
Figure 3
Manufacturing variability. We observed large variation between electrodes within the same Pt/Ir array. Shown here are 8 wires from four arrays pre-implant with imperfections as a result of manufacturing process. One of the wires is missing the recording tip whereas others have cracks in the insulation/recording tip, and uneven insulation at the interface of the recording surface/insulation.
Figure 4
Figure 4
(A) Pre-implant and post-explant SEM. Pre-implant and post-explant SEM images to show minimal to moderate changes at the recording site structure for the longest term animals. However, recording site changes occur as a result of corrosion of the recording surface for long-term implants. Shown here are three 6-month implants (F2, F4, F6), two 3-month animals (F7, F8), one 15-day animal (F11), and one 7-day animal (F14), respectively. A crack at the recording site can be observed to be developing in the electrode F2 (no. 5). (B) Insulation deterioration post-explant SEM. Post-explant SEM of individual microwire to indicate deterioration in electrode insulation for parylene-C coated Pt/Ir microwires. The deterioration occurs in the form of delamination and cracks. While the insulation deterioration varies among microwires even with the same array, we observed it to be present in all the wires across animals for all implant durations (7 days–6 months).
Figure 5
Figure 5
Effect of insulation damage. Pre-implant and post-explant SEM images are shown for four Pt/Ir electrodes in three chronic animals that undergoes delamination during their respective implant durations. Insulation delamination results in a decline in 1 KHz electrode impedance combined with poor functional performance (low yield). Functional performance is characterized by electrode yield on each of the recording days. A zero yield suggests that the respective electrode was not able to record a single unit whereas a 1 suggests that the electrode was able to record a single unit.
Figure 6
Figure 6
Electrode impedance and electrophysiology trends. Daily array yield (red) and average 1 KHz impedance trends (blue) for four long-term animals (F2, F4, F6: 6-months; F8: 3-months) to show the large daily variations in electrode impedance that result in low array yield. Array yield was defined as the percentage of electrodes out of 16 electrodes in an array that was able to isolate at least a single neuron during a recording session. Error bars depict standard deviations among the impedance values recorded from 16 electrodes during a recording session.
Figure 7
Figure 7
Histopathology. Histopathological staining of microglial cells in two chronically implanted animals, F8 (91 days, top panel) and F6 (180 days, bottom panel). In F8, poor electrode array yield was correlated with minimal microglial activation. Comparing Iba1 labeling on the non-implanted contralateral side (A) with the implanted side (B) it is evident that microglia display a characteristic resting morphology as well as similar density on both sides. There was only modest upregulation of ED1 and ferritin expression in F8, as seen in Table 2 and in panels (C,D). In F6, a moderate-to-good array yield correlated with minimal microglial activation. Comparing panels (A,B) microglia appear slightly hypertrophic and somewhat increased in number. Ferritin expression was upregulated modestly and to a similar extent as in F8 (Table 2). Panel (D) shows an example of the maximal ferritin upregulation observed around electrode tracks in this animal.
Figure 8
Figure 8
Hemorrhage. Increased ferritin expression in animals with poor electrode performance. Shown are micrographs from three different rats all illustrating dramatic upregulation of ferritin (see also Table 2). (A,B) F14 is 7 dpi (days post-implantation) and shows a 20-fold increase; (C,D) F9 is 71 dpi and shows a 48-fold increase; (E,F) F10 is 21 dpi and shows a 91-fold increase in ferritin expression over the control (left) side. The animals also show strong upregulation of both Iba1 and ED1 markers (Table 2). These histopathological findings are indicative of significant tissue damage, hemorrhage, and BBB disruption.
Figure 9
Figure 9
Combined analysis. Combined abiotic-biotic analysis to include histological, morphological, and functional performance for all animals to indicate contributing failure modes.

References

    1. Andrei A., Welkenhuysen M., Nuttin B., Eberle W. (2012). A response surface model predicting the in vivo insertion behavior of micromachined neural implants. J. Neural Eng. 9:016005 10.1088/1741-2560/9/1/016005 - DOI - PubMed
    1. Andrews R. J. (2010). Neuromodulation: advances in the next five years. Ann. N.Y. Acad. Sci. 1199, 204–211 10.1111/j.1749-6632.2009.05379.x - DOI - PubMed
    1. Barrese J. C., Rao N., Paroo K., Triebwasser C., Vargas-Irwin C., Franquemont L., et al. (2013). Failure mode analysis of silicon-based intracortical microelectrode arrays in non-human primates. J. Neural Eng. 10:066014 10.1088/1741-2560/10/6/066014 - DOI - PMC - PubMed
    1. Biran R., Martin D. C., Tresco P. A. (2005). Neuronal cell loss accompanies the brain tissue response to chronically implanted silicon microelectrode arrays. Exp. Neurol. 195, 115–126 10.1016/j.expneurol.2005.04.020 - DOI - PubMed
    1. Biran R., Martin D. C., Tresco P. A. (2007). The brain tissue response to implanted silicon microelectrode arrays is increased when the device is tethered to the skull. J. Biomed. Mater. Res. 82, 169–178 10.1002/jbm.a.31138 - DOI - PubMed