. 2014 Feb 3:5:61.
doi: 10.3389/fpsyg.2014.00061. eCollection 2014.

Does attentional selectivity in global/local processing improve discretely or gradually?

Affiliations

Does attentional selectivity in global/local processing improve discretely or gradually?

Ronald Hübner. Front Psychol. .

Abstract

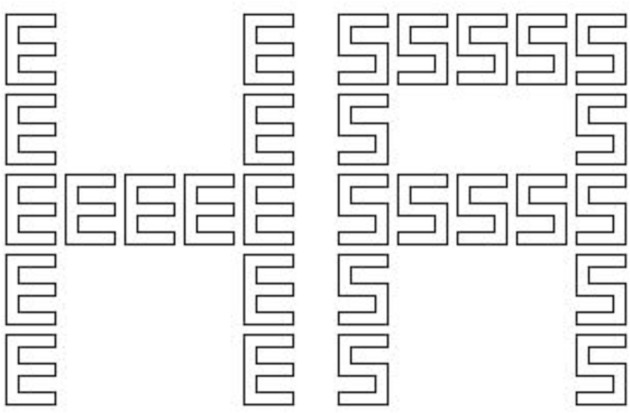
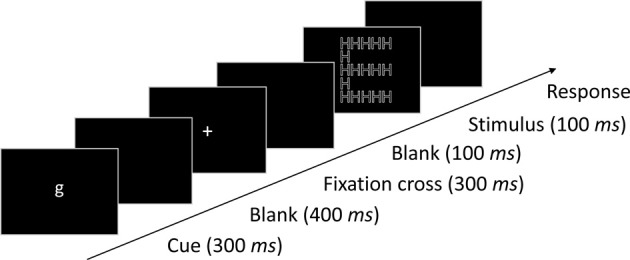
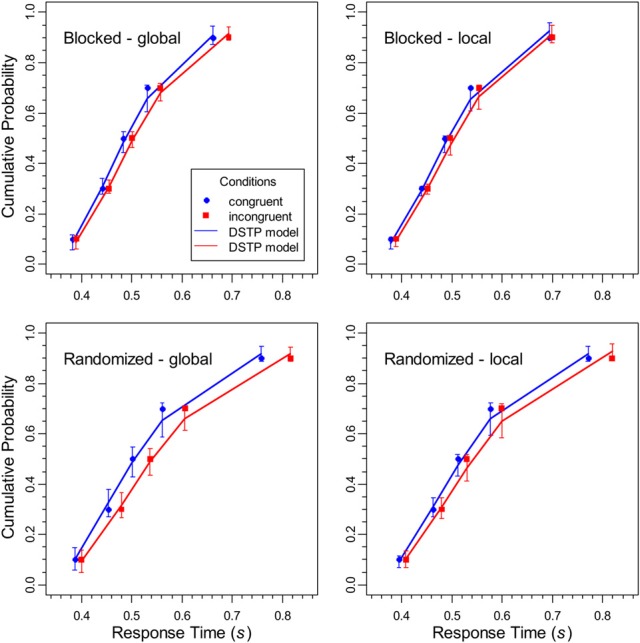
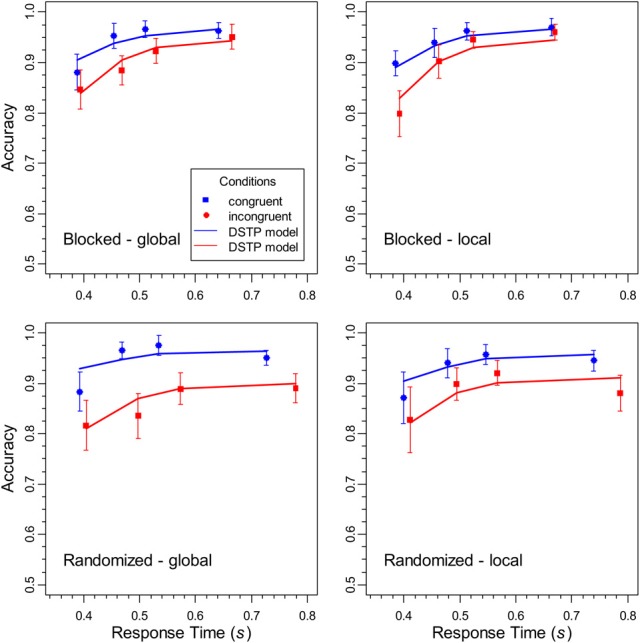
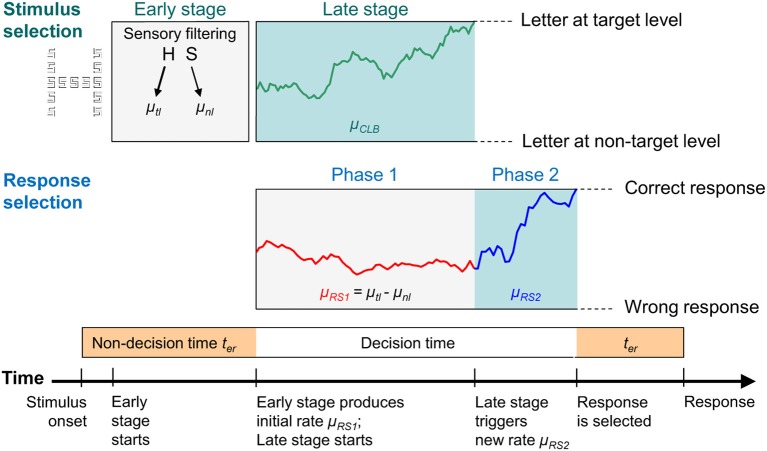
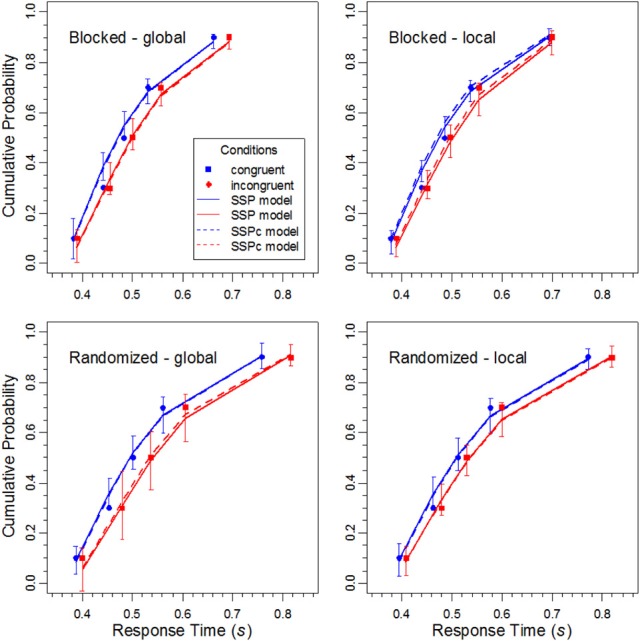
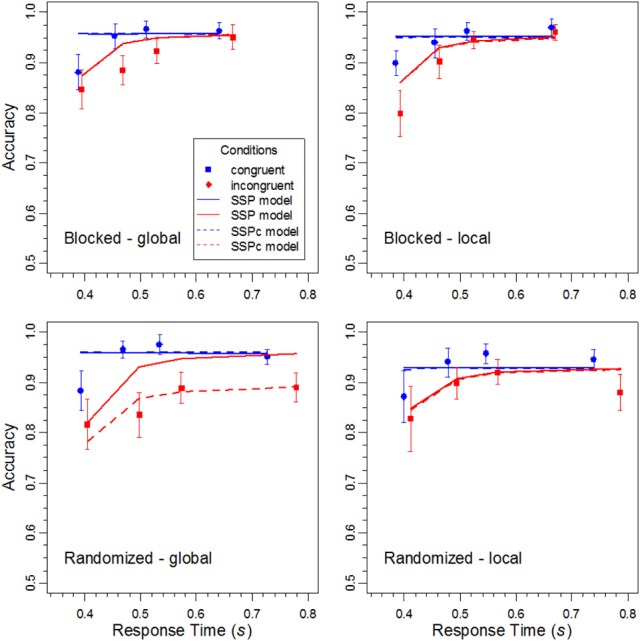
SOME RESULTS SUGGEST THAT ATTENTIONAL SELECTION IN GLOBAL/LOCAL PROCESSING OCCURS AT TWO STAGES: an early stage, where global and local information of a hierarchical stimulus is filtered or weighted according to the current goal, and a late stage, where the contents of the stimulus are bound to their respective level. Because it is assumed that binding improves attentional selectivity, accuracy should increase with response time. To see whether this prediction holds, a global/local experiment was conducted with hierarchical letters as stimuli, and where selection difficulty was varied by blocking vs. randomizing the target levels. The results show that accuracy indeed increased with response time, although to a lesser extent under randomized levels. Because an increasing accuracy is also compatible with a gradually improving selectivity, corresponding sequential sampling models were fit to the distributional data. The results show that a discretely improving attentional selectivity accounts better for the data. Moreover, the parameters of the corresponding model indicate that randomizing the target level impaired the efficiency of early selection as well as that of content-to-level binding.

Keywords: attentional selectivity; binding; early and late selection; global/local processing; sequential sampling.


Figures

Figure 1
Figure 1
Two examples of the hierarchical letters presented in the experiment. Both stimuli are incongruent. In the experiment the stimuli were presented in white on a black background.
Figure 2
Figure 2
The procedure applied in the experiment. In this example the cue (g) indicates global as target level.
Figure 3
Figure 3
The data points represent the cumulative distribution functions for the RTs of correct responses for the different conditions in the experiment, whereas the solid lines show the respective performance of the DSTP model. The error bars represent the 95%-confidence intervals of the theoretical function, estimated from the results of the jackknife procedure.
Figure 4
Figure 4
The data points represent the conditional accuracy functions for the different conditions in the experiment, and the error bars show the 95%-confidence intervals. The solid lines represent the corresponding performance of the DSTP model.
Figure 5
Figure 5
A graphical illustration of the dual-stage two-phase (DSTP) model. An early stage of stimulus selection (i.e., sensory filtering/weighting) provides component rates according to the information at the target level (μtl) and at the non-target level (μnl), which sum up to the drift rate μRS1 for Phase 1 of response selection. Because the stimulus is incongruent in this example, μnl is negative. In parallel with response selection in Phase 1, a late stimulus selection process (CLB) runs with rate μCLB until it reaches one of the two boundaries. Here, the upper boundary was hit, which leads to the binding of the target letter to the target level. After binding, response selection enters Phase 2, which is characterized by a new (higher) drift rate μRS2. The decision is completed as soon as the response selection process hits one of the two response boundaries reflecting the choice alternatives. The duration for the non-decisional processes (sensory filtering, motor execution, etc.) is captured by the parameter ter.
Figure 6
Figure 6
The data points show the cumulative distribution functions for the RTs of correct responses for the different conditions in the experiment, and solid lines represent the corresponding performance of the SSP model. The error bars represent the 95%-confidence intervals of the theoretical functions, estimated from the results of the jackknife procedure. The dashed lines show the performance of the SSPc model (see Text for details).
Figure 7
Figure 7
The data points represent the conditional accuracy functions for the different conditions in the experiment, and the error bars show the respective 95%-confidence intervals. The solid and dashed lines represent the performance of the SSP model and SSPc model, respectively.

References

    1. Beaucousin V., Cassotti M., Simon G., Pineau A., Kostova M., Houdé O., et al. (2011). ERP evidence of a meaningfulness impact on visual global/local processing: when meaning captures attention. Neuropsychologia 49, 1258–1266 10.1016/j.neuropsychologia.2011.01.039 - DOI - PubMed
    1. Boer L. C., Keuss P. J. (1982). Global precedence as a postperceptual effect: an analysis of speed-accuracy tradeoff functions. Percept. Psychophys. 31, 358–366 10.3758/BF03202660 - DOI - PubMed
    1. Brent R. P. (1973). Algorithms for Function Minimization without Derivatives. Englewood Cliffs, NJ: Prentice-Hall
    1. Desimone R., Duncan J. (1995). Neural mechanisms of selective visual attention. Annu. Rev. Neurosci. 18, 193–222 10.1146/annurev.ne.18.030195.001205 - DOI - PubMed
    1. Eriksen C. W., St. James J. D. (1986). Visual attention within and around the field of focal attention: a zoom lens model. Percept. Psychophys. 40, 225–240 10.3758/BF03211502 - DOI - PubMed

LinkOut - more resources