

Biophysical features of MagA expression in mammalian cells: implications for MRI contrast
- PMID: 24550900
- PMCID: PMC3913841
- DOI: 10.3389/fmicb.2014.00029
Biophysical features of MagA expression in mammalian cells: implications for MRI contrast
Abstract
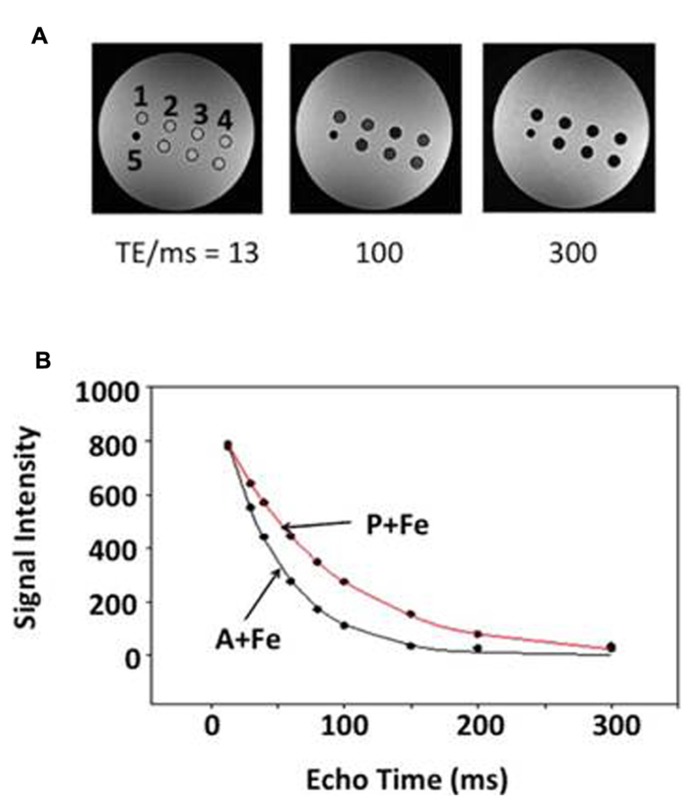
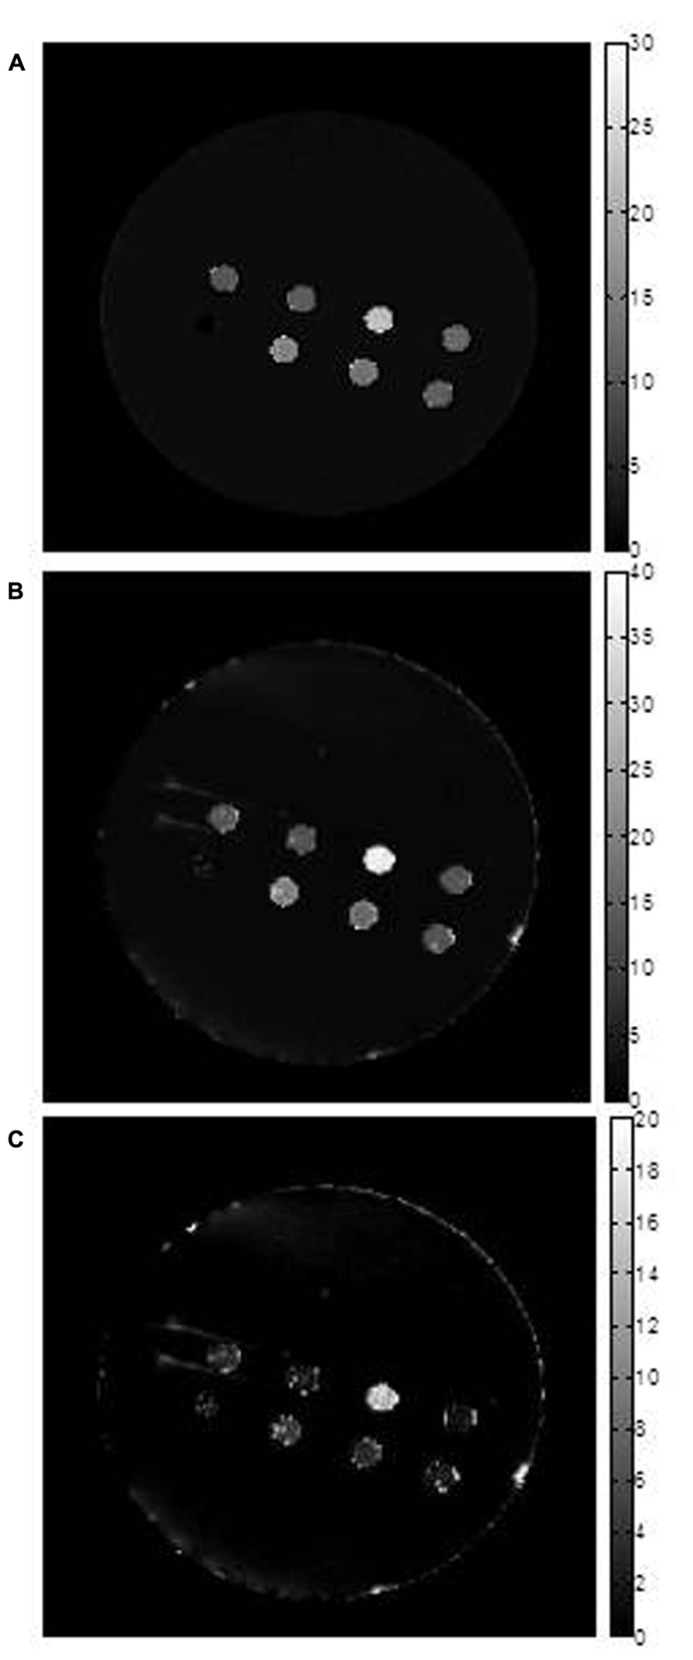
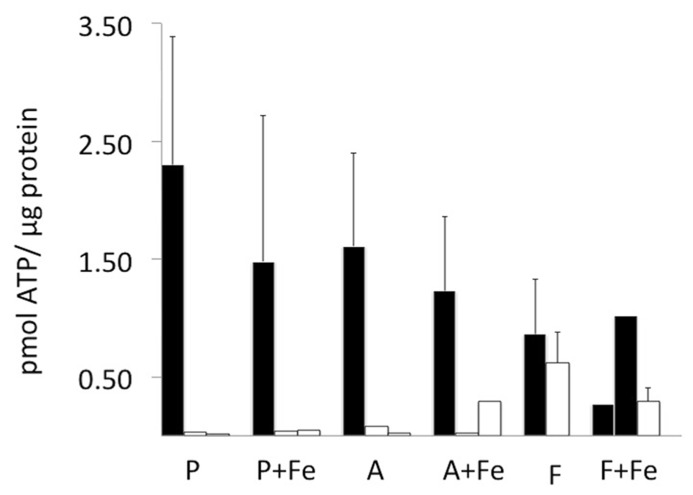
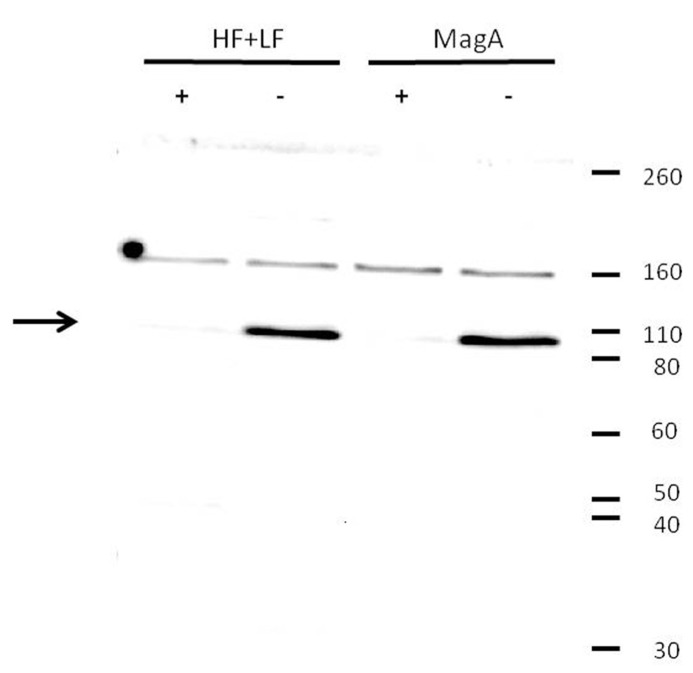
We compared overexpression of the magnetotactic bacterial gene MagA with the modified mammalian ferritin genes HF + LF, in which both heavy and light subunits lack iron response elements. Whereas both expression systems have been proposed for use in non-invasive, magnetic resonance (MR) reporter gene expression, limited information is available regarding their relative potential for providing gene-based contrast. Measurements of MR relaxation rates in these expression systems are important for optimizing cell detection and specificity, for developing quantification methods, and for refinement of gene-based iron contrast using magnetosome associated genes. We measured the total transverse relaxation rate (R2*), its irreversible and reversible components (R2 and R2', respectively) and the longitudinal relaxation rate (R1) in MDA-MB-435 tumor cells. Clonal lines overexpressing MagA and HF + LF were cultured in the presence and absence of iron supplementation, and mounted in a spherical phantom for relaxation mapping at 3 Tesla. In addition to MR measures, cellular changes in iron and zinc were evaluated by inductively coupled plasma mass spectrometry, in ATP by luciferase bioluminescence and in transferrin receptor by Western blot. Only transverse relaxation rates were significantly higher in iron-supplemented, MagA- and HF + LF-expressing cells compared to non-supplemented cells and the parental control. R2* provided the greatest absolute difference and R2' showed the greatest relative difference, consistent with the notion that R2' may be a more specific indicator of iron-based contrast than R2, as observed in brain tissue. Iron supplementation of MagA- and HF + LF-expressing cells increased the iron/zinc ratio approximately 20-fold, while transferrin receptor expression decreased approximately 10-fold. Level of ATP was similar across all cell types and culture conditions. These results highlight the potential of magnetotactic bacterial gene expression for improving MR contrast.
Keywords: MagA; cancer cells; iron; magnetic resonance imaging; modified ferritin subunits; relaxation rates.
Figures
Similar articles
-
MagA expression attenuates iron export activity in undifferentiated multipotent P19 cells.PLoS One. 2019 Jun 6;14(6):e0217842. doi: 10.1371/journal.pone.0217842. eCollection 2019. PLoS One. 2019. PMID: 31170273 Free PMC article.
-
Imaging tumor growth non-invasively using expression of MagA or modified ferritin subunits to augment intracellular contrast for repetitive MRI.Mol Imaging Biol. 2014 Feb;16(1):63-73. doi: 10.1007/s11307-013-0661-8. Mol Imaging Biol. 2014. PMID: 23836502
-
Investigating the Relationship between Transverse Relaxation Rate (R2) and Interecho Time in MagA-Expressing, Iron-Labeled Cells.Mol Imaging. 2015;14(12):551-60. doi: 10.2310/7290.2015.00027. Mol Imaging. 2015. PMID: 26637544
-
Using the magnetosome to model effective gene-based contrast for magnetic resonance imaging.Wiley Interdiscip Rev Nanomed Nanobiotechnol. 2012 Jul-Aug;4(4):378-88. doi: 10.1002/wnan.1165. Epub 2012 Mar 9. Wiley Interdiscip Rev Nanomed Nanobiotechnol. 2012. PMID: 22407727 Review.
-
Multispectral quantitative magnetic resonance imaging of brain iron stores: a theoretical perspective.Top Magn Reson Imaging. 2006 Feb;17(1):19-30. doi: 10.1097/01.rmr.0000245460.82782.69. Top Magn Reson Imaging. 2006. PMID: 17179894 Review.
Cited by
-
Essential magnetosome proteins MamI and MamL from magnetotactic bacteria interact in mammalian cells.Sci Rep. 2024 Nov 1;14(1):26292. doi: 10.1038/s41598-024-77591-4. Sci Rep. 2024. PMID: 39487238 Free PMC article.
-
The use of hydrogel-delivered extracellular vesicles in recovery of motor function in stroke: a testable experimental hypothesis for clinical translation including behavioral and neuroimaging assessment approaches.Neural Regen Res. 2021 Apr;16(4):605-613. doi: 10.4103/1673-5374.295269. Neural Regen Res. 2021. PMID: 33063708 Free PMC article.
-
A primer on in vivo cell tracking using MRI.Front Med (Lausanne). 2023 May 31;10:1193459. doi: 10.3389/fmed.2023.1193459. eCollection 2023. Front Med (Lausanne). 2023. PMID: 37324153 Free PMC article. Review.
-
Hepcidin-mediated Iron Regulation in P19 Cells is Detectable by Magnetic Resonance Imaging.Sci Rep. 2020 Feb 21;10(1):3163. doi: 10.1038/s41598-020-59991-4. Sci Rep. 2020. PMID: 32081948 Free PMC article.
-
MS-1 magA: Revisiting Its Efficacy as a Reporter Gene for MRI.Mol Imaging. 2016 Apr 26;15:1536012116641533. doi: 10.1177/1536012116641533. Print 2016. Mol Imaging. 2016. PMID: 27118760 Free PMC article.
References
-
- Bin Na H., Song I., Hyeon T. (2009). Inorganic nanoparticles for MRI contrast agents. Adv. Mater. 21 2133–214810.1002/adma.200802366 - DOI
LinkOut - more resources
Full Text Sources
Other Literature Sources
Research Materials
Miscellaneous