BiNA: a visual analytics tool for biological network data
- PMID: 24551056
- PMCID: PMC3923765
- DOI: 10.1371/journal.pone.0087397
BiNA: a visual analytics tool for biological network data
Abstract
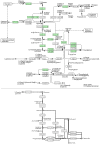
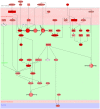
Interactive visual analysis of biological high-throughput data in the context of the underlying networks is an essential task in modern biomedicine with applications ranging from metabolic engineering to personalized medicine. The complexity and heterogeneity of data sets require flexible software architectures for data analysis. Concise and easily readable graphical representation of data and interactive navigation of large data sets are essential in this context. We present BiNA--the Biological Network Analyzer--a flexible open-source software for analyzing and visualizing biological networks. Highly configurable visualization styles for regulatory and metabolic network data offer sophisticated drawings and intuitive navigation and exploration techniques using hierarchical graph concepts. The generic projection and analysis framework provides powerful functionalities for visual analyses of high-throughput omics data in the context of networks, in particular for the differential analysis and the analysis of time series data. A direct interface to an underlying data warehouse provides fast access to a wide range of semantically integrated biological network databases. A plugin system allows simple customization and integration of new analysis algorithms or visual representations. BiNA is available under the 3-clause BSD license at http://bina.unipax.info/.
Conflict of interest statement
Figures


Similar articles
-
BNDB - the Biochemical Network Database.BMC Bioinformatics. 2007 Oct 2;8:367. doi: 10.1186/1471-2105-8-367. BMC Bioinformatics. 2007. PMID: 17910766 Free PMC article.
-
BisoGenet: a new tool for gene network building, visualization and analysis.BMC Bioinformatics. 2010 Feb 17;11:91. doi: 10.1186/1471-2105-11-91. BMC Bioinformatics. 2010. PMID: 20163717 Free PMC article.
-
MAVisto: a tool for biological network motif analysis.Methods Mol Biol. 2012;804:263-80. doi: 10.1007/978-1-61779-361-5_14. Methods Mol Biol. 2012. PMID: 22144158
-
Biological Network Inference and analysis using SEBINI and CABIN.Methods Mol Biol. 2009;541:551-76. doi: 10.1007/978-1-59745-243-4_24. Methods Mol Biol. 2009. PMID: 19381531 Review.
-
The importance of graph databases and graph learning for clinical applications.Database (Oxford). 2023 Jul 10;2023:baad045. doi: 10.1093/database/baad045. Database (Oxford). 2023. PMID: 37428679 Free PMC article. Review.
Cited by
-
IDARE2-Simultaneous Visualisation of Multiomics Data in Cytoscape.Metabolites. 2021 May 6;11(5):300. doi: 10.3390/metabo11050300. Metabolites. 2021. PMID: 34066448 Free PMC article.
-
Individualized medicine enabled by genomics in Saudi Arabia.BMC Med Genomics. 2015;8 Suppl 1(Suppl 1):S3. doi: 10.1186/1755-8794-8-S1-S3. Epub 2015 Jan 15. BMC Med Genomics. 2015. PMID: 25951871 Free PMC article. Review.
-
iCAVE: an open source tool for visualizing biomolecular networks in 3D, stereoscopic 3D and immersive 3D.Gigascience. 2017 Aug 1;6(8):1-13. doi: 10.1093/gigascience/gix054. Gigascience. 2017. PMID: 28814063 Free PMC article.
-
MyomirDB: A unified database and server platform for muscle atrophy myomiRs, coregulatory networks and regulons.Sci Rep. 2020 May 25;10(1):8593. doi: 10.1038/s41598-020-65319-z. Sci Rep. 2020. PMID: 32451429 Free PMC article.
-
NetConfer: a web application for comparative analysis of multiple biological networks.BMC Biol. 2020 May 19;18(1):53. doi: 10.1186/s12915-020-00781-9. BMC Biol. 2020. PMID: 32430035 Free PMC article.
References
-
- Albrecht M, Kerren A, Klein K, Kohlbacher O, Mutzel P, et al. (2009) On open problems in biological network visualization. International Symposium on Graph Drawing: Springer. pp. 256–267.
-
- Boehringer Mannheim GmbH - Biochemica Website. Roche Biochemical Pathway Chart. Available: http://web.expasy.org/pathways/. Accessed 2014 January 17.
-
- Michal G (1998) Biochemical Pathways: An atlas of biochemistry and molecular biology: John Wiley and Sons Ltd.
-
- BioCarta Website. Charting pathway of life. Available: http://www.biocarta.com/. Accessed 2014 January 17.
Publication types
MeSH terms
LinkOut - more resources
Full Text Sources
Other Literature Sources

