

Asymmetric segregation of damaged cellular components in spatially structured multicellular organisms
- PMID: 24551071
- PMCID: PMC3923766
- DOI: 10.1371/journal.pone.0087917
Asymmetric segregation of damaged cellular components in spatially structured multicellular organisms
Abstract
The asymmetric distribution of damaged cellular components has been observed in species ranging from fission yeast to humans. To study the potential advantages of damage segregation, we have developed a mathematical model describing ageing mammalian tissue, that is, a multicellular system of somatic cells that do not rejuvenate at cell division. To illustrate the applicability of the model, we specifically consider damage incurred by mutations to mitochondrial DNA, which are thought to be implicated in the mammalian ageing process. We show analytically that the asymmetric distribution of damaged cellular components reduces the overall damage level and increases the longevity of the cell population. Motivated by the experimental reports of damage segregation in human embryonic stem cells, dividing symmetrically with respect to cell-fate, we extend the model to consider spatially structured systems of cells. Imposing spatial structure reduces, but does not eliminate, the advantage of asymmetric division over symmetric division. The results suggest that damage partitioning could be a common strategy for reducing the accumulation of damage in a wider range of cell types than previously thought.
Conflict of interest statement
Figures
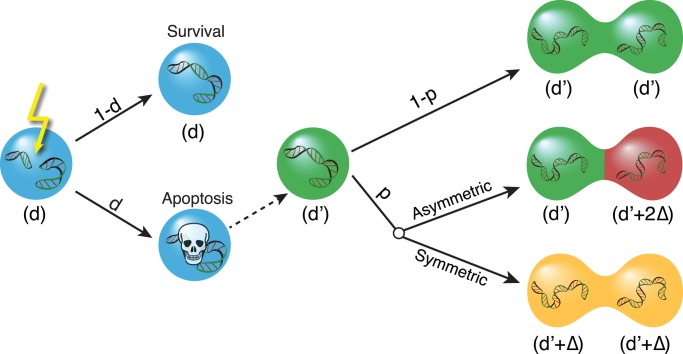
 , in which case another random cell, with damage level
  , proliferates to replace it. If the selected cell does not go apoptotic, it remains in the cell population unchanged. The probability that the mitochondrial genome has acquired additional damage
  since the last cell division is
  . The daughter cells therefore have a probability
  of inheriting a damage level of
  and a probability
  of inheriting additional damage. This may be distributed symmetrically, with both cells receiving
  damage, or it may be segregated asymmetrically, leading to one cell with a damage level of
  and one with a damage level of
  . We define one time unit of the simulation to be
  time steps, such that, on average, each cell is selected once per time unit.
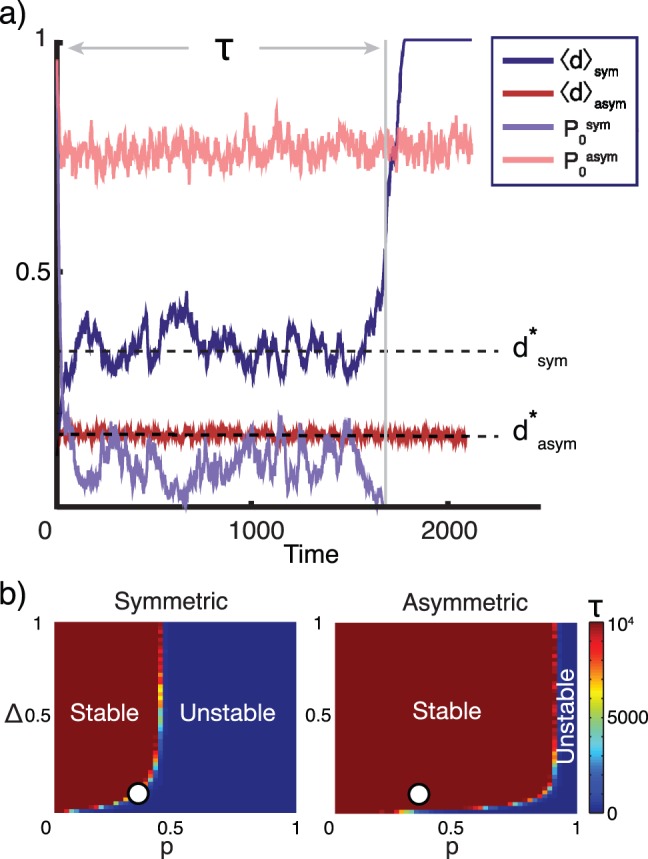
 and a higher fraction
  of cells with the initial damage level, compared to cells that divide symmetrically. When the number of undamaged cells fluctuates down to zero, the average damage level will quickly increase from the steady state value
  to 1, corresponding to a system collapse. This happens after a characteristic time
  . Parameters used:
  ,
,  ,
,  ,
,  . Other choices of parameters yield similar results. b) Stability of steady state. The time
  before system collapse decreases with the mutation probability
  and increases with higher mitochondrial fragility
  . Notably, cell populations that divide asymmetrically stay in steady state for much longer time than populations with symmetric division. White circles represent the set of parameters used in panel a.
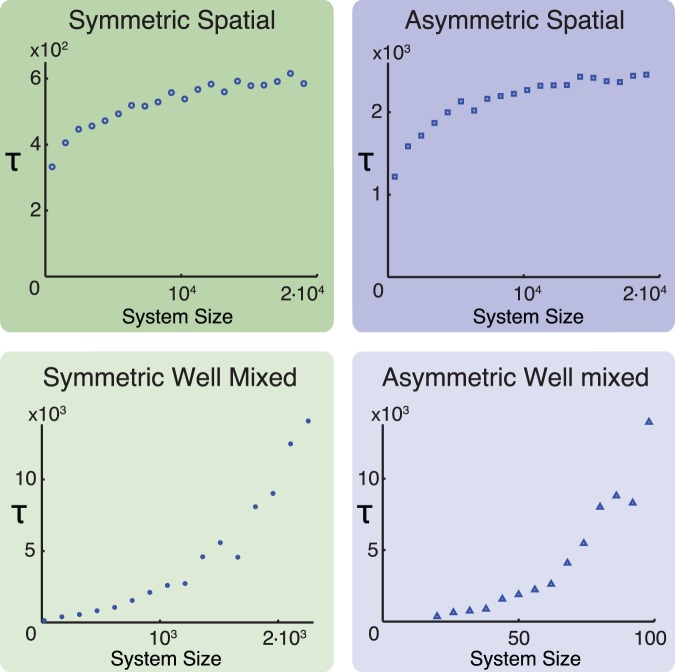
 before system collapse increases drastically with the number of cells in the population. In systems with spatial structure, where apoptotic cells can only be replaced by neighboring cells,
  saturates with increasing
  , corresponding to an €effective system size for each cell. Both for spatial and well mixed systems, asymmetric division significantly increases the longevity of the cell population compared to symmetrically dividing populations of the same size. Notice that the asymmetric well mixed system has been studied using smaller cell populations due to the more rapid divergence of
  relative to the symmetric well mixed system. Each data point represents the median time before collapse out of 20 simulations. Parameters used:
  ,
,  ,
,  . Other choices of parameters yield similar results.
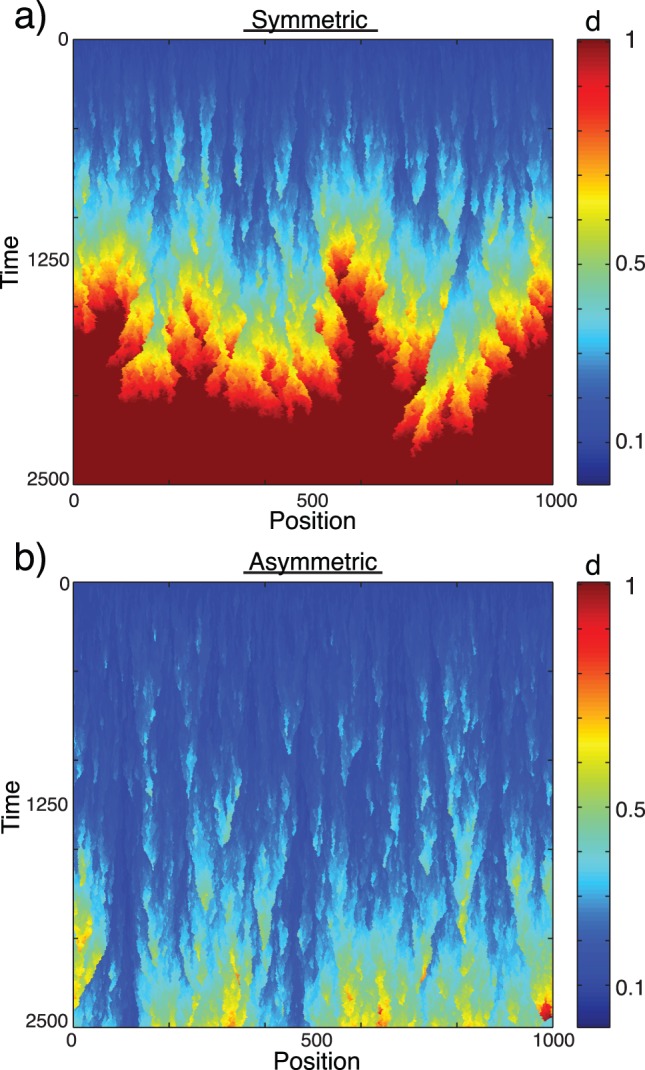
 , but soon clusters of damaged cells occur. The boundary between damaged and less damaged clusters performs a random walk with a drift towards the more damaged cells, since these are less likely to go apoptotic. Eventually the system will collapse to a state where all cells have damage level
  . This happens much sooner for a symmetrically dividing cell population than for one that divides asymmetrically. The parameters are:
  ,
,  ,
,  . Other choices of parameters yield similar results.
Similar articles
-
Evolution of asymmetric damage segregation : a modelling approach.Subcell Biochem. 2012;57:315-30. doi: 10.1007/978-94-007-2561-4_14. Subcell Biochem. 2012. PMID: 22094428 Review.
-
Synergistic effects of repair, resilience and retention of damage determine the conditions for replicative ageing.Sci Rep. 2020 Jan 31;10(1):1556. doi: 10.1038/s41598-020-58444-2. Sci Rep. 2020. PMID: 32005954 Free PMC article.
-
Mitochondrial mutations, cellular instability and ageing: modelling the population dynamics of mitochondria.Mutat Res. 1993 Aug;295(3):93-103. doi: 10.1016/0921-8734(93)90011-q. Mutat Res. 1993. PMID: 7689701
-
Mitochondrial DNA mutation and the ageing process: bioenergy and pharmacological intervention.Mutat Res. 1992 Sep;275(3-6):195-208. doi: 10.1016/0921-8734(92)90023-i. Mutat Res. 1992. PMID: 1383761 Review.
-
Statistical theory of asymmetric damage segregation in clonal cell populations.Math Biosci. 2023 Apr;358:108980. doi: 10.1016/j.mbs.2023.108980. Epub 2023 Feb 17. Math Biosci. 2023. PMID: 36804386
Cited by
-
Imperfect asymmetry: The mechanism governing asymmetric partitioning of damaged cellular components during mitosis.Bioarchitecture. 2014;4(6):203-9. doi: 10.1080/19490992.2015.1014213. Epub 2015 May 5. Bioarchitecture. 2014. PMID: 25941938 Free PMC article.
References
-
- Wallace D (1999) Mitochondrial diseases in man and mouse. Science 283: 1482–1488. - PubMed
-
- Klinger H, Rinnerthaler M, Lam Y, Laun P, Heeren G, et al. (2010) Quantitation of (a) symmetric inheritance of functional and of oxidatively damaged mitochondrial aconitase in the cell division of old yeast mother cells. Experimental gerontology 45: 533–542. - PubMed
Publication types
MeSH terms
Substances
LinkOut - more resources
Full Text Sources
Other Literature Sources
Medical
