. 2014 Feb 13;9(2):e88339.
doi: 10.1371/journal.pone.0088339. eCollection 2014.

Variation, evolution, and correlation analysis of C+G content and genome or chromosome size in different kingdoms and phyla

Affiliations

Variation, evolution, and correlation analysis of C+G content and genome or chromosome size in different kingdoms and phyla

Xiu-Qing Li et al. PLoS One. .

Abstract

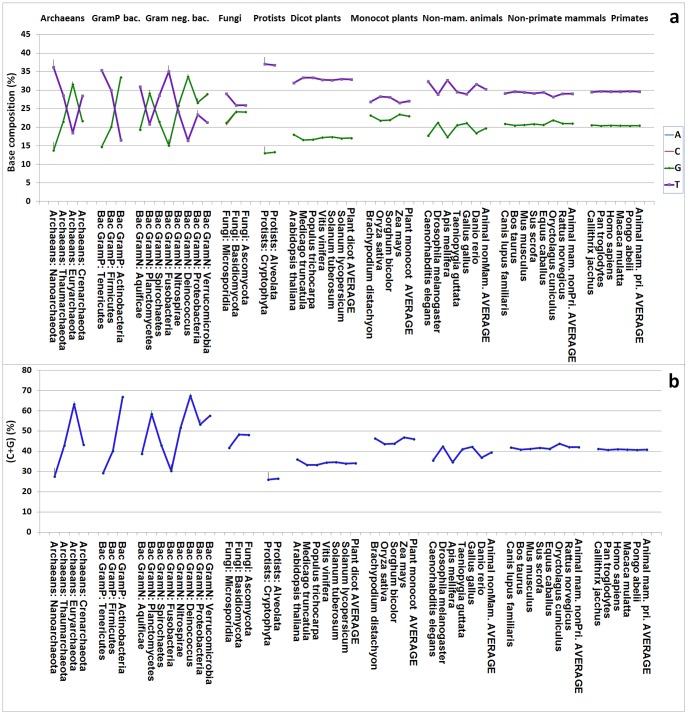
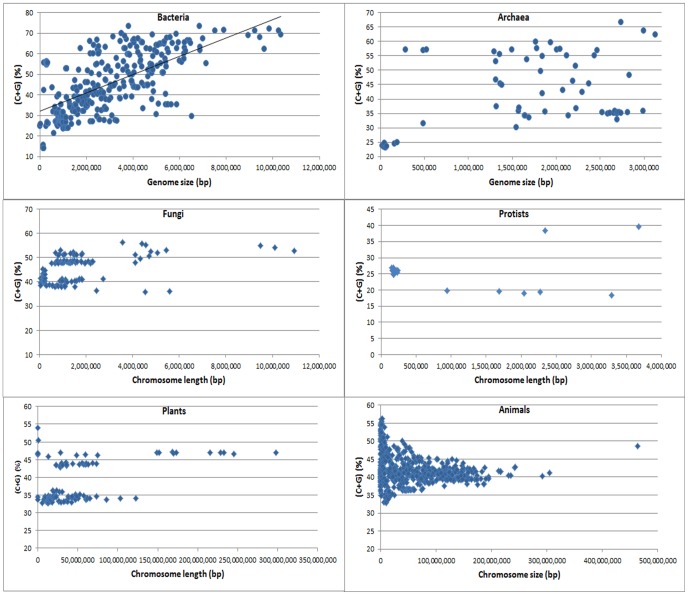
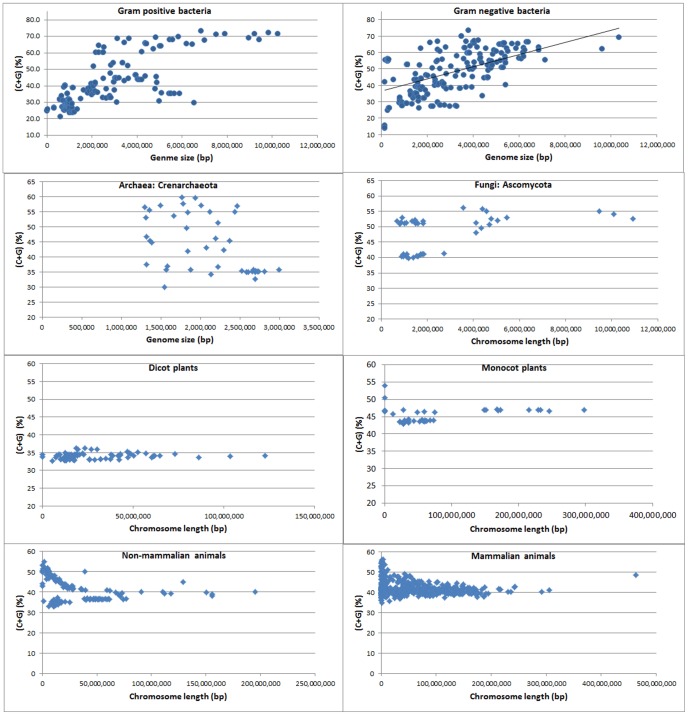
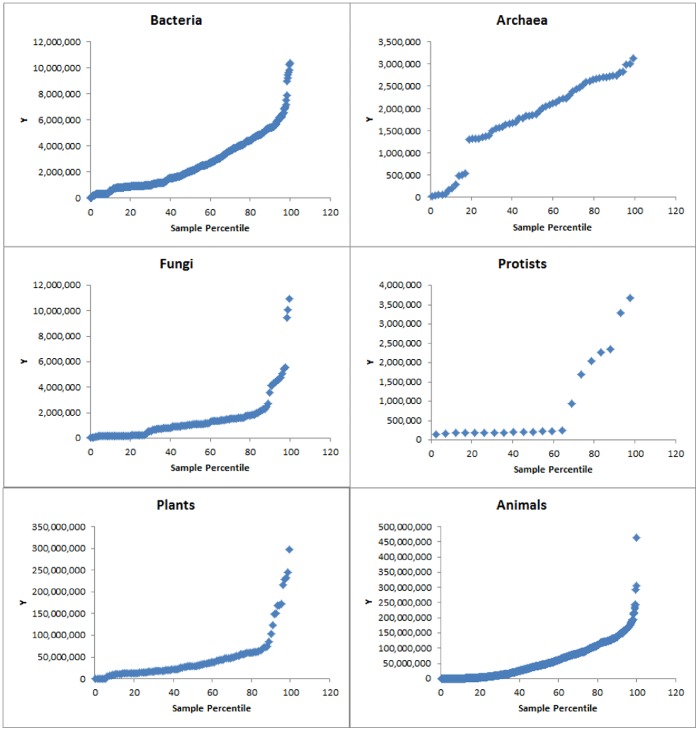
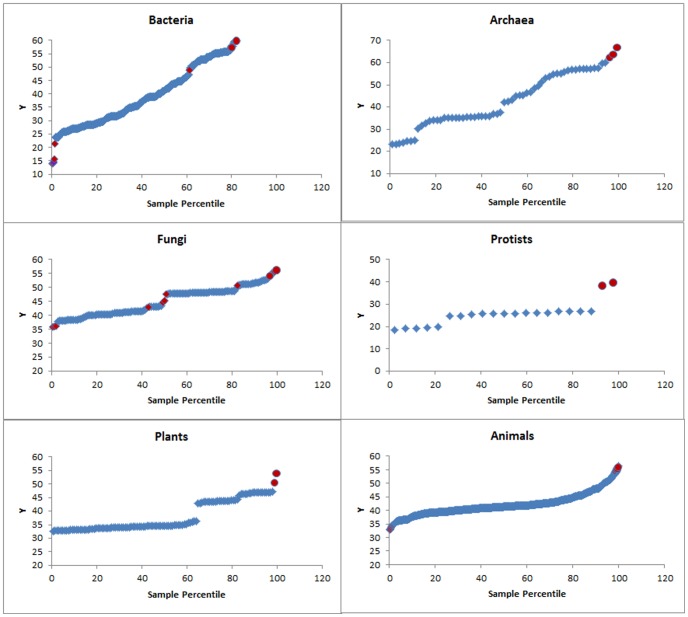
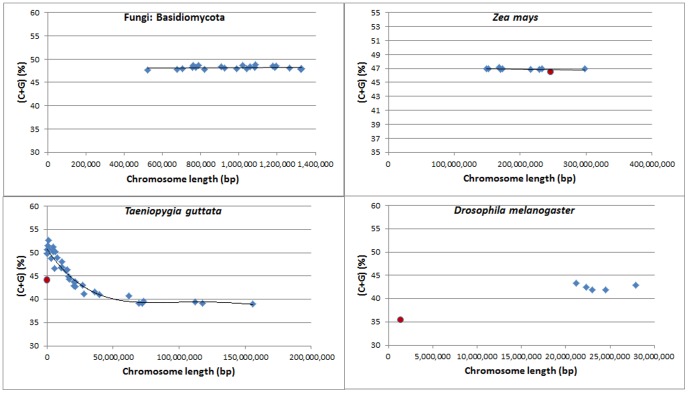
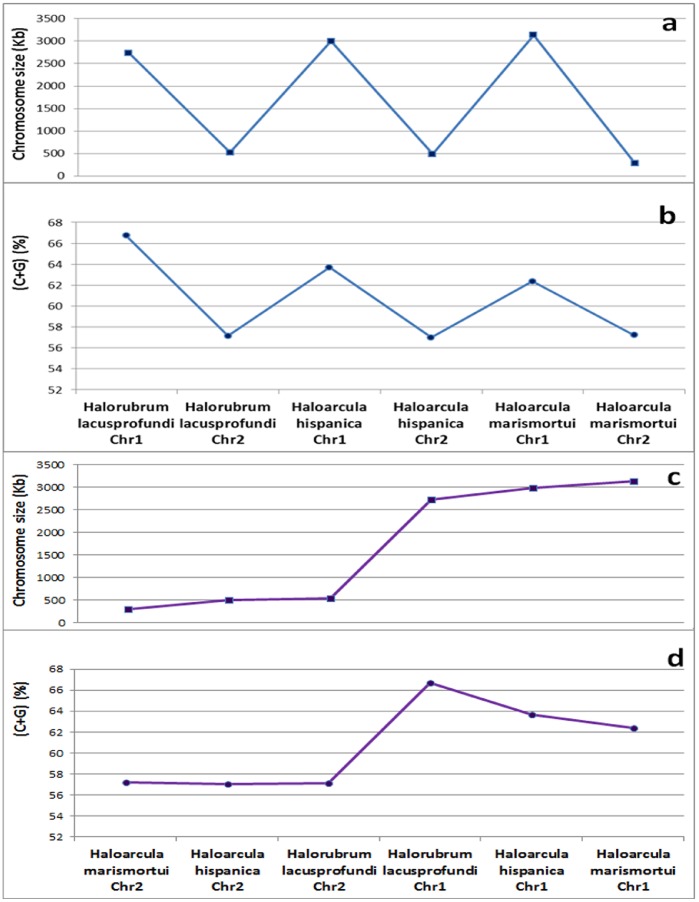
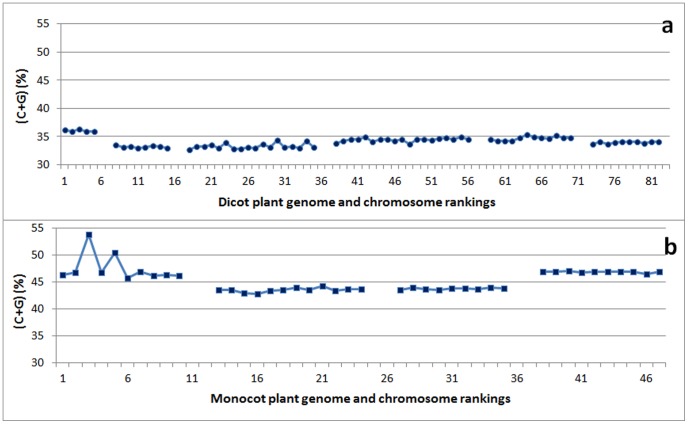
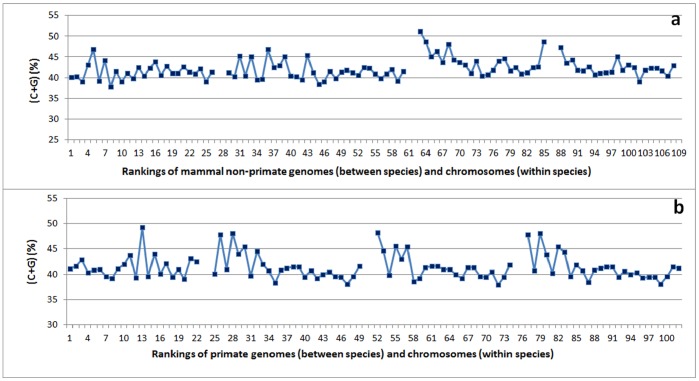
C+G content (GC content or G+C content) is known to be correlated with genome/chromosome size in bacteria but the relationship for other kingdoms remains unclear. This study analyzed genome size, chromosome size, and base composition in most of the available sequenced genomes in various kingdoms. Genome size tends to increase during evolution in plants and animals, and the same is likely true for bacteria. The genomic C+G contents were found to vary greatly in microorganisms but were quite similar within each animal or plant subkingdom. In animals and plants, the C+G contents are ranked as follows: monocot plants>mammals>non-mammalian animals>dicot plants. The variation in C+G content between chromosomes within species is greater in animals than in plants. The correlation between average chromosome C+G content and chromosome length was found to be positive in Proteobacteria, Actinobacteria (but not in other analyzed bacterial phyla), Ascomycota fungi, and likely also in some plants; negative in some animals, insignificant in two protist phyla, and likely very weak in Archaea. Clearly, correlations between C+G content and chromosome size can be positive, negative, or not significant depending on the kingdoms/groups or species. Different phyla or species exhibit different patterns of correlation between chromosome-size and C+G content. Most chromosomes within a species have a similar pattern of variation in C+G content but outliers are common. The data presented in this study suggest that the C+G content is under genetic control by both trans- and cis- factors and that the correlation between C+G content and chromosome length can be positive, negative, or not significant in different phyla.


Conflict of interest statement

Competing Interests: The author has declared that no competing interests exist.

Figures

Figure 1
Figure 1. The base compositions and C+G contents of different kingdoms and large groups.
The information is provided by phylum for archaeans, gram-positive bacteria, gram-negative bacteria, fungi, and protists and by species for dicot plants, monocot plants, non-mammalian animals, non-primate mammalian animals, and primate animals. Note that in panel (a), the A and T contents essentially overlap and are indistinguishable, and a similar situation exist for the C and G contents.
Figure 2
Figure 2. Distribution of values of chromosome size and C+G content in each kingdom of living organisms.
The chromosome number for bacteria, archaea, fungi, protists, plants, and animals is 430, 61, 139, 21, 115, and 565, respectively. Note that the C+G content and chromosome or genome size in bacteria is positively correlated but there is no such a correlation or linear relationship in other kingdoms.
Figure 3
Figure 3. Distribution of values of chromosome size and the C+G content in each subkingdom.
The chromosome number for Gram-positive bacteria, Gram-negative bacteria, Crenarchaeota, and Ascomycota is 184, 246, 42, and 61, respectively. The chromosome or large scaffold number for dicot plants, monocot plants, non-mammalian animals, and mammalian animals is 74, 41, 120, and 445, respectively. Note that C+G content and chromosome or genome size in both Gram-positive and Gram-negative bacteria are positively correlated but there is linear relationship in other subkingdoms. Note that in Crenarchaeota (archaea) there are two groups in the distribution. The lower right corner group is Sulfolobus species. There is no correlation between C+G content and genome size within each of the two distribution group of Crenarchaeota.
Figure 4
Figure 4. Normal probability plots of genome/chromosome size (bp, the Y-axis).
Note that the large genomes/chromosomes (on the right of each plot) do not fit a normal distribution.
Figure 5
Figure 5. Normal probability plots of C+G contents (%, the Y-axis).
Note that the lowest and the highest C+G contents (on the left and right, respectively, of each plot) do not fit a normal distribution. Red dots: outliers.
Figure 6
Figure 6. Distribution of C+G contents and genome/chromosome sizes showing some outliers.
Blue diamonds: genome or chromosomes which appear to be normally distributed. Red round dots: outliers.
Figure 7
Figure 7. The chromosome sizes and C+G contents of three Archaea species, which each have one large chromosome (Chr1) and one small chromosome (Chr2).
The three species (Haloarcula hispanica, Haloarcula marismortui, and Halorubrum lacusprofundi) belong to the Euryarchaeota. Note that although the C+G contents appear to be correlated with chromosome sizes in (a) and (b), the C+G contents are actually negatively correlated with chromosome size within each type of chromosome (Chr1 and Chr2), as shown in (c) and (d).
Figure 8
Figure 8. The C+G contents (%) per chromosome in dicot and monocot plants, ranked by genome size among species and by chromosome size within each species.
Panel (a) shows dicot plants, namely (in order from left to right) Arabidopsis thaliana, Medicago truncatula, Populus trichocarpa, Vitis vinifera, Solanum tuberosum, and Solanum lycopersicum. For S. lycopersicum, chromosomes 6 and 8 were analyzed together as one file, and chromosome 10 and 12 also as one file because they were together in the downloaded files. Panel (b) shows monocot plants, namely (in order from left to right): Brachypodium distachyon, Oryza sativa, Sorghum bicolor, and Zea mays. Note that there is very little variation in C+G content between chromosomes within each dicot or monocot species, with the exception of B. distachyon.
Figure 9
Figure 9. The C+G content (%) per chromosome in mammals, ranked by genome size among species and by chromosome size within each species, from smallest to largest.
Panel (a) shows non-primate mammalian animals, namely (in order from left to right) Mus musculus, Equus caballus, Oryctolagus cuniculus, and Rattus norvegicus. Panel (b) shows primate animals, namely (in order from left to right) Callithrix jacchus, Pan troglodytes, Macaca mulatta, and Pongo abelii. Note that the patterns are quite similar among the last three species of primate animals.

Similar articles

Cited by

References

    1. Chargaff E, Lipshitz R, Green C (1952) Composition of the desoxypentose nucleic acids of four genera of sea-urchin. J Biol Chem 195: 155–160. - PubMed
    1. Watson JD, Crick FHC (1953) Molecular structure of nucleic acids: A structure for deoxyribose nucleic acid. Nature 171: 737–738. - PubMed
    1. Cionini PG, Bassi P, Cremonini R, Cavallini A (1985) Cytological localization of fast renaturing and satellite DNA sequences in Vicia faba . Protoplasma 124: 106–111.
    1. Appels R, Dennis ES, Smyth DR, Peacock WJ (1981) Two repeated DNA sequences from the heterochromatic regions of rye (Secale cereale) chromosomes. Chromosoma 84: 265–277.
    1. Nellåker C, Li F, Uhrzander F, Tyrcha J, Karlsson H (2009) Expression profiling of repetitive elements by melting temperature analysis: Variation in HERV-W gag expression across human individuals and tissues. BMC Genomics 10: 532. - PMC - PubMed

Publication types

LinkOut - more resources