

Starvation induces phenotypic diversification and convergent evolution in Vibrio vulnificus
- PMID: 24551129
- PMCID: PMC3923799
- DOI: 10.1371/journal.pone.0088658
Starvation induces phenotypic diversification and convergent evolution in Vibrio vulnificus
Abstract
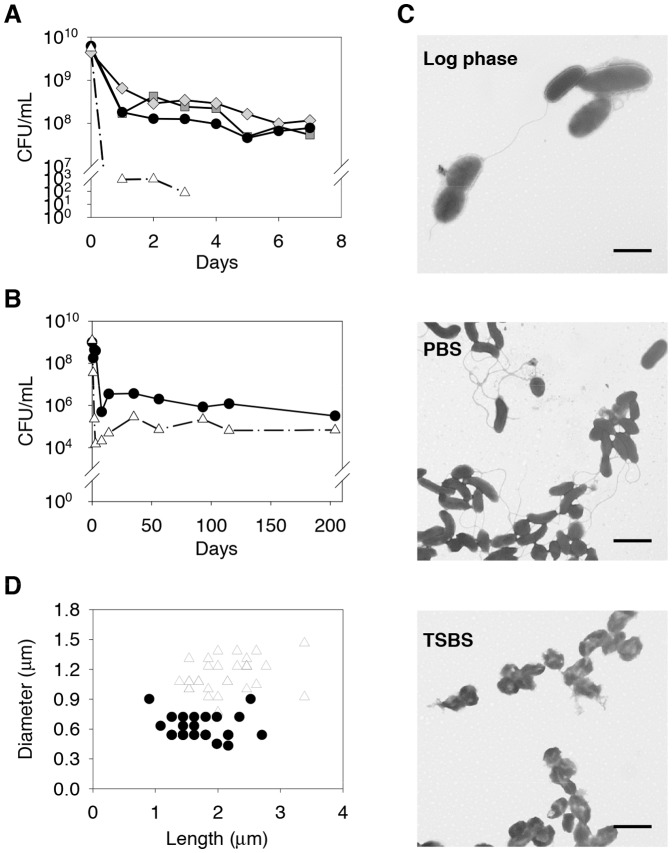
Starvation is a common stress experienced by bacteria living in natural environments and the ability to adapt to and survive intense stress is of paramount importance for any bacterial population. A series of starvation experiments were conducted using V. vulnificus 93U204 in phosphate-buffered saline and seawater. The starved population entered the death phase during the first week and approximately 1% of cells survived. After that the population entered a long-term stationary phase, and could survive for years. Starvation-induced diversification (SID) of phenotypes was observed in starved populations and phenotypic variants (PVs) appeared in less than 8 days. The cell density, rather than the population size, had a major effect on the extent of SID. SID was also observed in strain YJ016, where it evolved at a faster pace. PVs appeared to emerge in a fixed order: PV with reduced motility, PV with reduced proteolytic activity, and PV with reduced hemolytic activity. All of the tested PVs had growth advantages in the stationary phase phenotypes and increased fitness compared with 93U204 cells in co-culture competition experiments, which indicates that they had adapted to starvation. We also found that SID occurred in natural seawater with a salinity of 1%-3%, so this mechanism may facilitate bacterial adaptation in natural environments.
Conflict of interest statement
Figures


Similar articles
-
Characterization of the low-salinity stress in Vibrio vulnificus.J Food Prot. 2008 Feb;71(2):416-9. doi: 10.4315/0362-028x-71.2.416. J Food Prot. 2008. PMID: 18326198
-
Growth-Inhibitory Effect of d-Tryptophan on Vibrio spp. in Shucked and Live Oysters.Appl Environ Microbiol. 2018 Sep 17;84(19):e01543-18. doi: 10.1128/AEM.01543-18. Print 2018 Oct 1. Appl Environ Microbiol. 2018. PMID: 30030231 Free PMC article.
-
Susceptibility of the heat-, acid-, and bile-adapted Vibrio vulnificus to lethal low-salinity stress.J Food Prot. 2006 Dec;69(12):2924-8. doi: 10.4315/0362-028x-69.12.2924. J Food Prot. 2006. PMID: 17186660
-
The interactions of Vibrio vulnificus and the oyster Crassostrea virginica.Microb Ecol. 2013 May;65(4):807-16. doi: 10.1007/s00248-012-0162-3. Epub 2013 Jan 3. Microb Ecol. 2013. PMID: 23280497 Review.
-
Vibrio vulnificus: a physiological and genetic approach to the viable but nonculturable response.J Infect Chemother. 2000 Jun;6(2):115-20. doi: 10.1007/pl00012150. J Infect Chemother. 2000. PMID: 11810549 Review.
Cited by
-
Complete Genome Sequence of Vibrio vulnificus 93U204, a Bacterium Isolated from Diseased Tilapia in Taiwan.Genome Announc. 2014 Oct 2;2(5):e01005-14. doi: 10.1128/genomeA.01005-14. Genome Announc. 2014. PMID: 25278541 Free PMC article.
-
The Ecological Coherence of Temperature and Salinity Tolerance Interaction and Pigmentation in a Non-marine Vibrio Isolated from Salar de Atacama.Front Microbiol. 2016 Dec 1;7:1943. doi: 10.3389/fmicb.2016.01943. eCollection 2016. Front Microbiol. 2016. PMID: 27990141 Free PMC article.
-
Molecular Basis of Stationary Phase Survival and Applications.Front Microbiol. 2017 Oct 16;8:2000. doi: 10.3389/fmicb.2017.02000. eCollection 2017. Front Microbiol. 2017. PMID: 29085349 Free PMC article. Review.
-
Survival Characteristics and Transcriptomic Analyses Reveal the Adaptive Response of the Aquatic Pathogen Non-O1/O139 Vibrio cholerae to Starvation Stress.Microbiol Spectr. 2022 Jun 29;10(3):e0193921. doi: 10.1128/spectrum.01939-21. Epub 2022 May 9. Microbiol Spectr. 2022. PMID: 35532354 Free PMC article.
-
The Effect of Visible Light on Cell Envelope Subproteome during Vibrio harveyi Survival at 20 °C in Seawater.Microorganisms. 2021 Mar 13;9(3):594. doi: 10.3390/microorganisms9030594. Microorganisms. 2021. PMID: 33805730 Free PMC article.
References
MeSH terms
Substances
LinkOut - more resources
Full Text Sources
Other Literature Sources
Research Materials
