. 2014 Feb 13;9(2):e89070.
doi: 10.1371/journal.pone.0089070. eCollection 2014.

Binding of histone H1 to DNA is differentially modulated by redox state of HMGB1

Affiliations

Binding of histone H1 to DNA is differentially modulated by redox state of HMGB1

Eva Polanská et al. PLoS One. .

Abstract

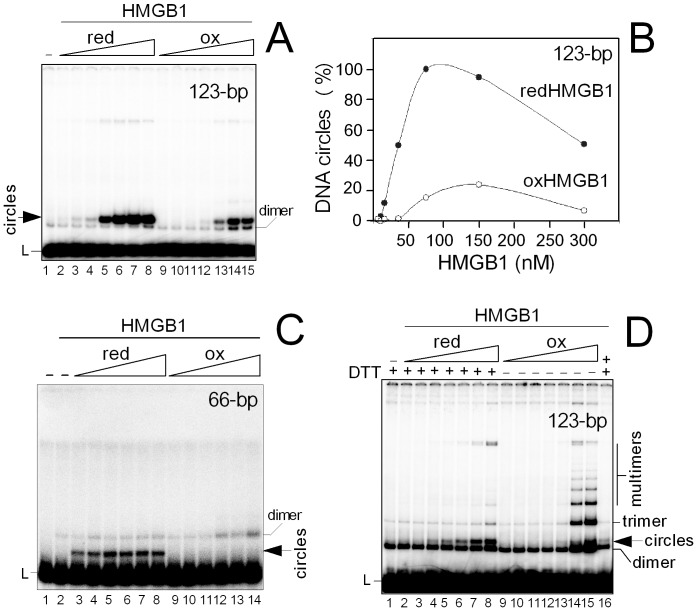
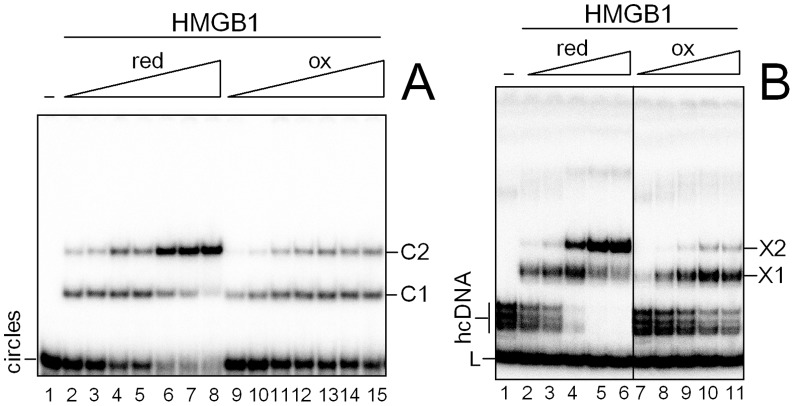
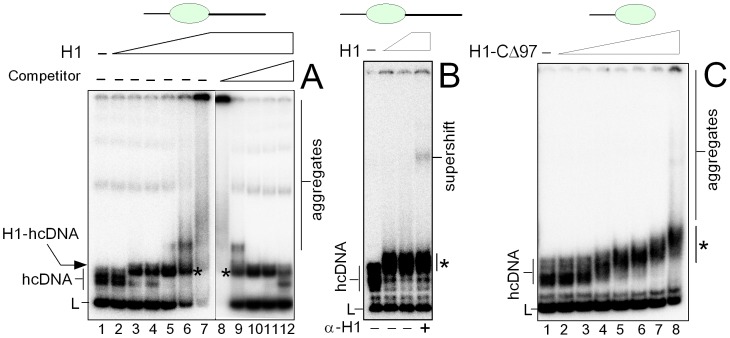
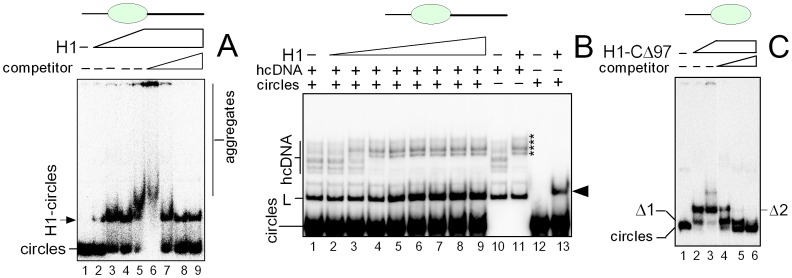
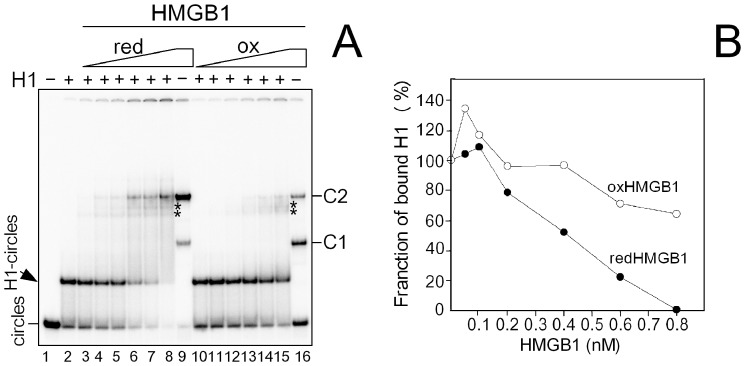
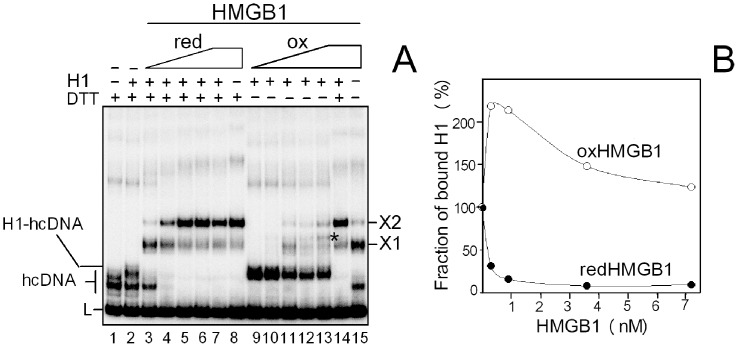
HMGB1 is an architectural protein in chromatin, acting also as a signaling molecule outside the cell. Recent reports from several laboratories provided evidence that a number of both the intracellular and extracellular functions of HMGB1 may depend on redox-sensitive cysteine residues of the protein. In this study we demonstrate that redox state of HMGB1 can significantly modulate the ability of the protein to bind and bend DNA, as well as to promote DNA end-joining. We also report a high affinity binding of histone H1 to hemicatenated DNA loops and DNA minicircles. Finally, we show that reduced HMGB1 can readily displace histone H1 from DNA, while oxidized HMGB1 has limited capacity for H1 displacement. Our results suggested a novel mechanism for the HMGB1-mediated modulation of histone H1 binding to DNA. Possible biological consequences of linker histones H1 replacement by HMGB1 for the functioning of chromatin are discussed.


Conflict of interest statement

Competing Interests: The authors have declared that no competing interests exist.

Figures

Figure 1
Figure 1. Domain structure of HMGB1, cysteine residues of HMGB1 and oxidation, hcDNA.
(A) Domain structure of HMGB1 with two DNA binding domains, and polyanionic C-tail. (B) Schematic representation of cysteine residues of HMGB1 and formation of a disulphide bridge between Cys23 and Cys45. (C) Mild oxidation of HMGB1 in the presence of Cu2+ results in increased mobility in PAGE due to formation of an intramolecular disulphide bond by opposing Cys23 and Cys45, in agreement with MALDI-TOF mass spectrometry. Equal amounts (4 µg) of oxidized or reduced HMGB1 samples were loaded on the SDS-15%-polyacrylamide gel. Notice that oxidization of HMGB1 compromised Coomassie blue-staining of the protein in the gel. Arrow indicates electrophoretic mobility of HMGB1 dimer (formed due to an intermolecular cross-link of two HMGB1 molecules via the disulphide bridge). (D) Schematic drawing of hemicatenated DNA loops (hcDNA). hcDNA was created from a sequence containing a tract of poly(CA)·poly(TG) that can form a loop maintained at its base by hemicatenane, i.e. the junction of two DNA duplexes in which one of the strands of one duplex passes between the two strands of the other duplex , . The drawing was kindly provided by François Strauss (National Museum of Natural History, Paris, France).
Figure 2
Figure 2. Redox state-dependent modulation of DNA bending and end-joining by HMGB1.
(A) DNA bending by HMGB1. 32P-labeled 123-bp DNA duplex (∼0.2 nM) was pre-incubated with different amounts of reduced or oxidized HMGB1 (6, 10, 15, 35, 75, 150 and 300 nM; lanes 2–8), followed by ligation with T4 DNA ligase as detailed under “Materials and Methods”. (B) Percentage of DNA minicircles from ligase-mediated circularization assay in the presence of reduced or oxidized HMGB1. 100% denotes production of DNA minicircles at 75 nM reduced HMGB1 protein. Presented data are based on four independent experiments. redHMGB1, reduced HMGB1; oxHMGB1, oxidized HMGB1. (C) DNA bending by HMGB1. 32P-labeled 66-bp DNA duplex (∼1 nM) was pre-incubated with different amounts of reduced or oxidized HMGB1 (50, 100, 150, 200, 250 and 400 nM; lanes 3–8), followed by ligation with T4 DNA ligase as detailed under “Materials and Methods”. Lane 1, no ligase added. (D) DNA end-joining by HMGB1. The 32P-labeled 123-bp DNA fragment (∼2 nM) was pre-incubated with different amounts of reduced or oxidized HMGB1 (10, 20, 40, 60, 100, 150 and 200 nM; lanes 2–8), followed by ligation with T4 DNA ligase as in panels (A) and (B). Lane 16 in panel (D) corresponds to the reaction in lane 14 in which the oxidized HMGB1 was pre-treated with 10 mM DTT before addition of ligase. L, linear 123-bp DNA duplex.
Figure 3
Figure 3. Redox state-dependent interaction of HMGB1 with DNA.
(A) Interaction of HMGB1 with small DNA circles. Increasing amounts of reduced or oxidized HMGB1 (typically 25–800 pM; lanes 2–8 and 9–15, respectively) were added to 32P-labeled DNA minicircles (∼30 pM). C1 and C2 indicate specific complexes of HMGB1 with DNA minicircles. (B) Interaction of HMGB1 with hcDNA. Increasing amounts of reduced or oxidized HMGB1 (typically 5 to 300 pM; lanes 2–6 and 7–11, respectively) were added to 32P-labeled hcDNA (1.5 pM). X1 and X2 indicate the specific HMGB1-hcDNA complexes. Protein-DNA complexes were resolved on 8% (panel A) or 6% (panel B) polyacrylamide gels in 0.5x TBE and visualized by autoradiography. Representative pictures of at least four experiments are shown. K d values for redHMGB1 and oxHMGB1 proteins were estimated as detailed in the “Materials and Methods”. redHMGB1, reduced HMGB1; oxHMGB1, oxidized HMGB1.
Figure 4
Figure 4. High affinity binding of human histone H1 to hemicatenated DNA loops.
(A) Binding of H1 to hcDNA. 32P-labeled hcDNA (∼15 pM) was titrated with increasing amounts of histone H1 (3, 6, 9, 12, 18, and 36 nM, lanes 2–7) in the absence of competitor DNA. The H1-hcDNA complex at 36 nM H1 in the presence of increasing amounts of competitor linear DNA (10-, 102-, 103-, 104-, and 5×10⁴-fold mass excess of unlabeled linear DNA over 32P-labeled hcDNA; lanes 8–12, left to right). (B) Detection of H1 binding to hcDNA by specific anti-H1 antibody. Gel loading (left to right): hcDNA, hcDNA with 2.5 or 5 nM H1. H1-hcDNA complex (at 5 nM H1) with anti-H1 antibody (indicated by +). Binding experiments were performed at 103-fold excess of unlabeled competitor DNA. (C) Binding of H1-CΔ97 to hcDNA. 32P-labeled hcDNA (∼15 pM) was titrated with increasing amounts of histone H1 lacking the C-terminal domain (peptide H1-CΔ97) (8, 20, 40, 60, 80, 120 and 240 nM, lanes 2–8) in the absence of competitor linear DNA. The H1-DNA complexes were resolved on 8% or 6% polyacrylamide gels in 0.5x TBE and visualized by autoradiography as detailed in the “Materials and Methods”. Asterisks indicate the H1-hcDNA complexes.
Figure 5
Figure 5. Binding of histone H1 to DNA minicircles.
(A) Titration of DNA minicircles with histone H1. 32P-labeled DNA minicircles of 66-bp (∼30 pM) were titrated with histone H1 (2, 4, 8 and 15 nM, lanes 2–5) in the absence of competitor DNA. The H1-minicircles complex (prepared at 15 nM H1, lane 5) was also titrated with increasing amount competitor λ-DNA (10, 102, 103 and 104-fold mass excess of unlabeled competitor DNA over 32P-labeled minicircles; lanes 6–9, left to right). L, linear DNA of 66-bp. (B) Competition of DNA minicircles for histone H1 binding to hcDNA. An equimolar mixture of 32P-labeled DNA minicircles (66-bp) and hcDNA (∼30 pM) was titrated with histone H1 (2, 6, 9, 12, 18, 30, 50, 80 nM, lanes 2–9). 32P-labeled hcDNA without (lane 10) or with (lane 11) 15 nM H1 (the H1-hcDNA complexes are indicated by asterisks). 32P-labeled DNA minicircles without (lane 12) or with (lane 13) 15 nM H1. Arrowhead indicates position of the H1-DNA minicircles complex. (C) Binding of H1-CΔ197 to DNA minicircles. 32P-labeled DNA minicircles (∼30 pM) were titrated with increasing amounts of histone H1 lacking the C-terminal domain (peptide H1-CΔ97) (10 and 20 nM, lanes 2 and 3) in the absence of competitor DNA. Complex (H1-CΔ97)-DNA minicircles (prepared at 20 nM H1 peptide, lane 3) was also titrated with increasing amounts of competitor λ-DNA (103, 104 and 105-fold mass excess of unlabeled competitor DNA over 32P-labeled DNA minicircles, lanes 4–6, left to right). Δ1 and Δ2 indicate the (H1-CΔ97)-DNA minicircles complexes. H1-DNA complexes were resolved on 8% or 6% polyacrylamide gels in 0.5×TBE and visualized by autoradiography as detailed in the “Materials and Methods”.
Figure 6
Figure 6. Binding of histone H1 to DNA minicircles is modulated by redox state of HMGB1.
(A) Titration of the H1-DNA complex with reduced or oxidized HMGB1. 32P-labeled 66-bp DNA minicircles (30 pM) were pre-incubated with histone H1 (∼15 nM) and titrated with either reduced or oxidized HMGB1 (0.05, 0.1, 0.2, 0.4, 0.6 and 0.8 nM; lanes 3–8 or 10–15, respectively). HMGB1-DNA complexes prepared at 0.8 nM of reduced (lane 9) or oxidized (lane 16) HMGB1 with no H1 added. Arrowhead denotes the H1-DNA complexes. C1 and C2 denote specific HMGB1-DNA complexes. Asterisks indicate mobility of the ternary H1-HMGB1-DNA complexes. (B) Fraction of bound H1 plotted against HMGB1 concentration. Fraction of bound H1 = 100% on axis Y denotes initial amount of bound histone H1 before addition of HMGB1. Concentrations of reduced or oxidized HMGB1 proteins are indicated on axis X. Experiments were performed in triplicates with two different preparations of DNA minicircles and three different amounts of H1. redHMGB1, reduced HMGB1; oxHMGB1, oxidized HMGB1.
Figure 7
Figure 7. Binding of histone H1 to hcDNA is modulated by redox state of HMGB1.
(A) Titration of the H1-hcDNA complex with reduced or oxidized HMGB1. 32P-labeled hcDNA (15 pM) was pre-incubated with histone H1 (∼1 nM, lane 2) and titrated with either reduced or oxidized HMGB1 (0.3, 0.9, 1.8, 3.6 and 7.2 nM; lanes 3–7 and 9–13, respectively). Lane 8, redHMGB1-hcDNA complex (prepared at 7.2 nM HMGB1) with no H1 added. Lane 15, oxHMGB1-hcDNA complex (prepared at 7.2 nM HMGB1) with no H1 added. Lane 14, oxHMGB1-H1-hcDNA complex from lane 13 treated with 10 mM DTT. L, linear fragment used for the preparation of hcDNA. Asterisk indicates electrophoretic mobility of the ternary complex H1-HMGB1-hcDNA. X1 and X2 denote the specific HMGB1-hcDNA complexes. (B) Fraction of H1 bound to hcDNA plotted against HMGB1 concentration. Fraction of bound H1 = 100% on axis Y denotes initial amount histone H1 bound to hcDNA before addition of HMGB1. Concentrations of reduced or oxidized HMGB1 proteins are indicated on axis X. Experiments were performed in quadruplicates with two different preparations of hcDNA. redHMGB1, reduced HMGB1; oxHMGB1, oxidized HMGB1.
Figure 8
Figure 8. Binding of reduced and oxidized HMGB1 to histone H1 in free solution.
H1 was mixed with reduced HMGB1 (lanes 1–4) or oxidized HMGB1 (lanes 5–8) at a molar ratio 1:1 and treated with dimethyl suberimidate for the times indicated. Cross-linking of (individual proteins) H1 (lanes 9–10), redHMGB1 (lanes 11–12) and oxHMGB1 (lanes 13–14) is shown. M, molecular mass marker; redHMGB1, reduced HMGB1 protein; oxHMGB1, oxidized HMGB1 protein. Gel was stained with silver.

References

    1. Štros M (2010) HMGB proteins: interactions with DNA and chromatin. Biochim Biophys Acta 1799: 101–113. - PubMed
    1. Tang D, Billiar TR, Lotze MT (2012) A Janus tale of two active high mobility group box 1 (HMGB1) redox states. Mol Med 18: 1360–1362. - PMC - PubMed
    1. Li G, Liang X, Lotze MT (2013) HMGB1: The Central Cytokine for All Lymphoid Cells. Front Immunol 4: 68. - PMC - PubMed
    1. Calogero S, Grassi F, Aguzzi A, Voigtlander T, Ferrier P, et al. (1999) The lack of chromosomal protein Hmg1 does not disrupt cell growth but causes lethal hypoglycaemia in newborn mice. Nat Genet 22: 276–280. - PubMed
    1. Hoppe G, Talcott KE, Bhattacharya SK, Crabb JW, Sears JE (2006) Molecular basis for the redox control of nuclear transport of the structural chromatin protein Hmgb1. Exp Cell Res 312: 3526–3538. - PubMed

Publication types

MeSH terms

LinkOut - more resources