. 2014 Feb 14;9(2):e89352.
doi: 10.1371/journal.pone.0089352. eCollection 2014.

Filamin B regulates chondrocyte proliferation and differentiation through Cdk1 signaling

Affiliations

Filamin B regulates chondrocyte proliferation and differentiation through Cdk1 signaling

Jianjun Hu et al. PLoS One. .

Abstract

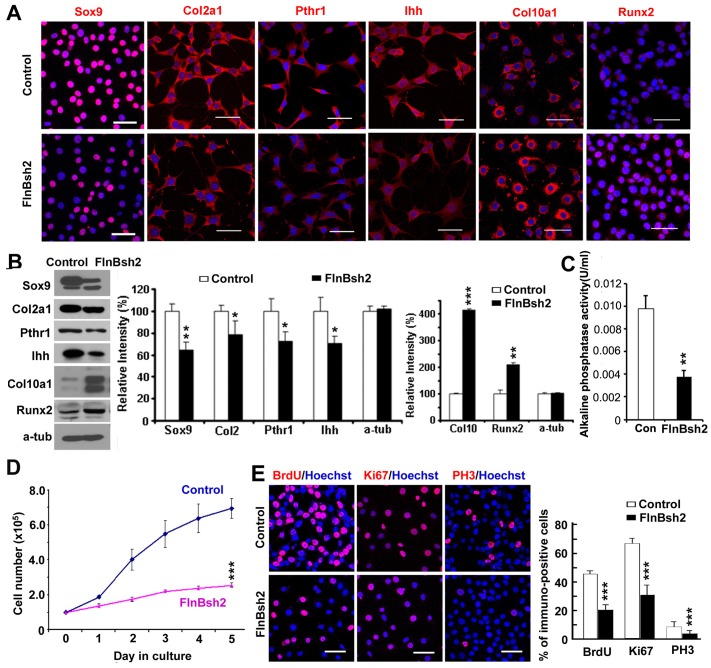
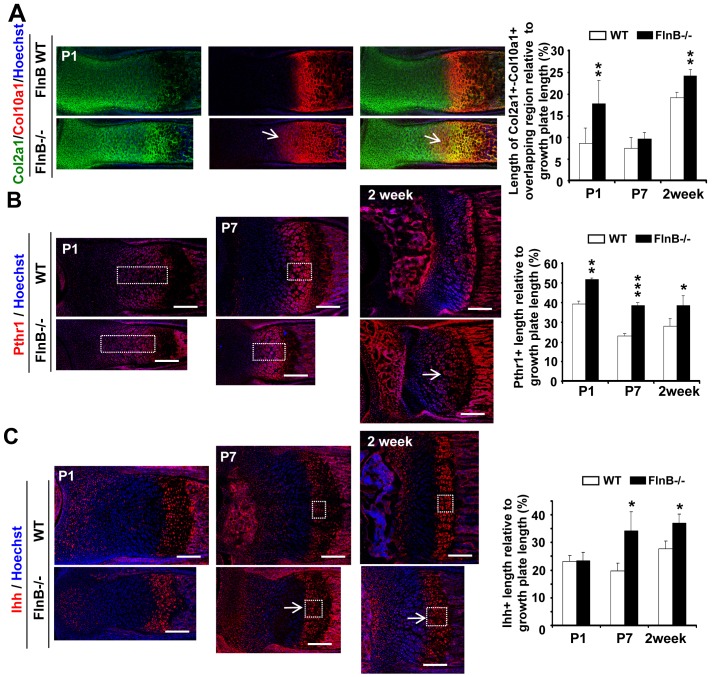
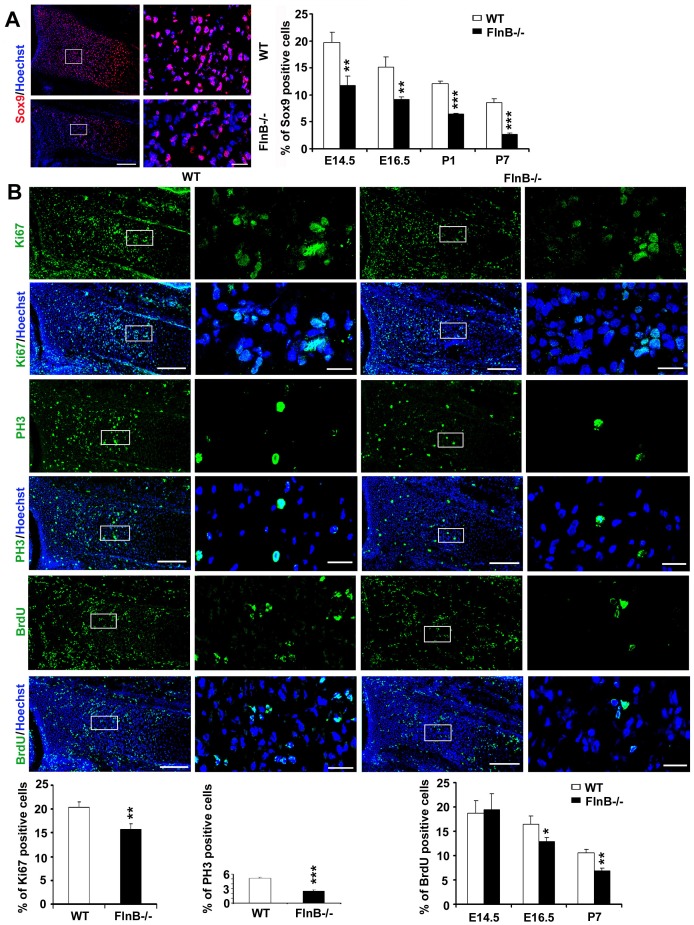
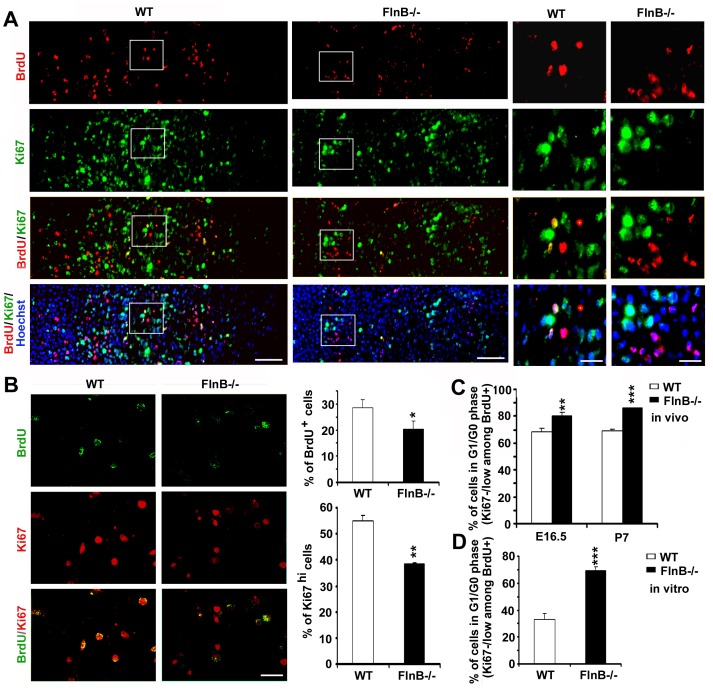
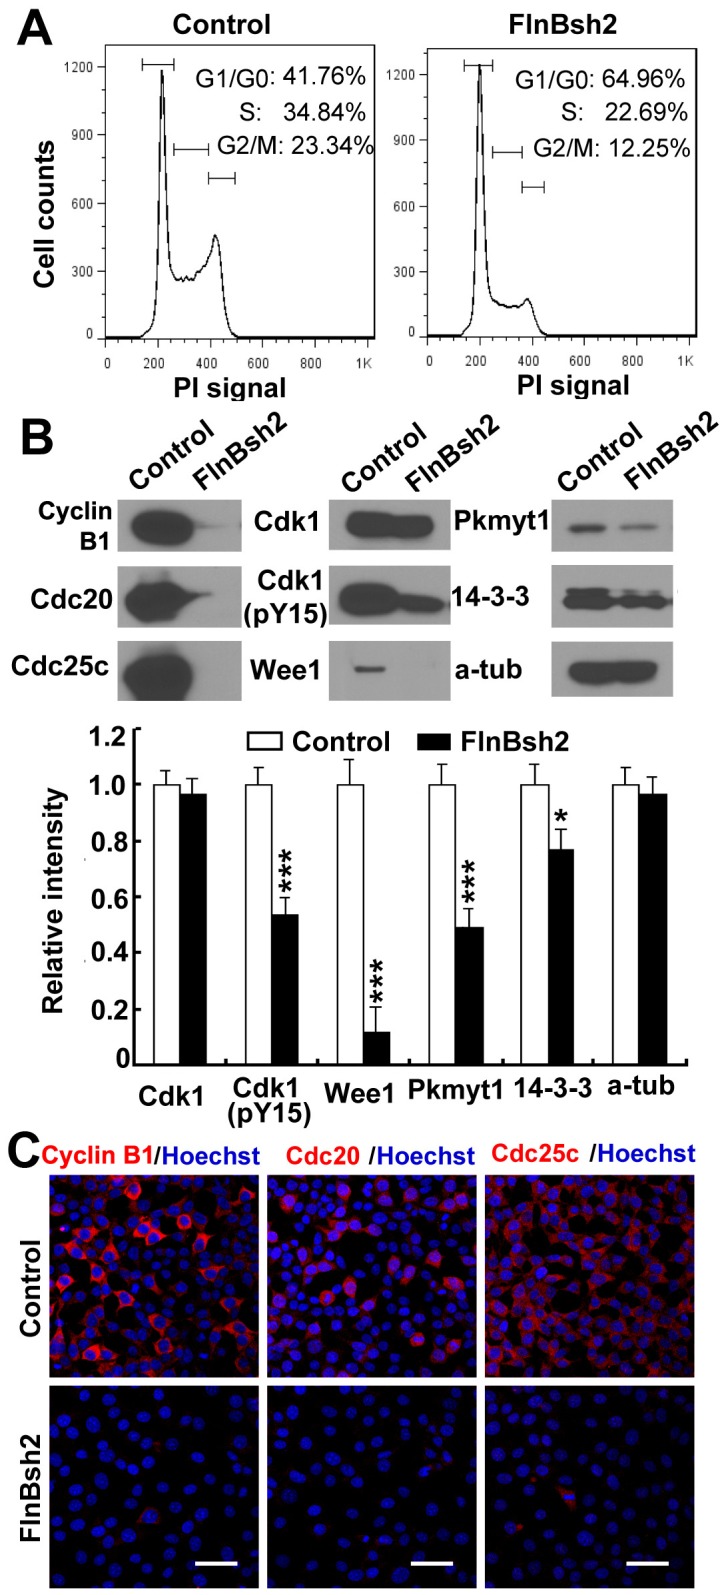
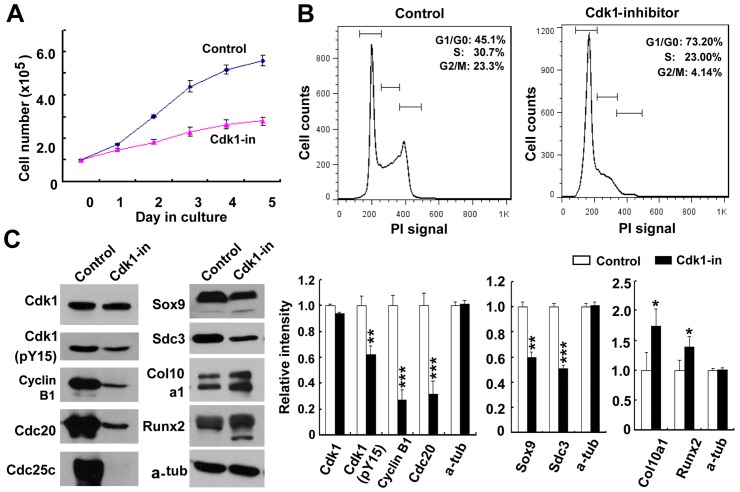
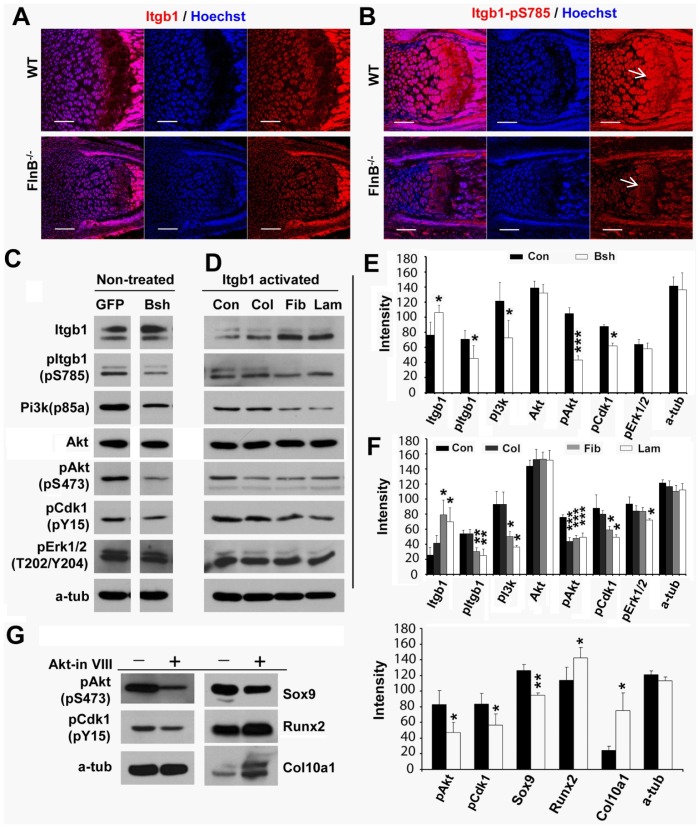
Humans who harbor loss of function mutations in the actin-associated filamin B (FLNB) gene develop spondylocarpotarsal syndrome (SCT), a disorder characterized by dwarfism (delayed bone formation) and premature fusion of the vertebral, carpal and tarsal bones (premature differentiation). To better understand the cellular and molecular mechanisms governing these seemingly divergent processes, we generated and characterized FlnB knockdown ATDC5 cell lines. We found that FlnB knockdown led to reduced proliferation and enhanced differentiation in chondrocytes. Within the shortened growth plate of postnatal FlnB(-/-) mice long bone, we observed a similarly progressive decline in the number of rapidly proliferating chondrocytes and premature differentiation characterized by an enlarged prehypertrophic zone, a widened Col2a1(+)/Col10a1(+) overlapping region, but relatively reduced hypertrophic zone length. The reduced chondrocyte proliferation and premature differentiation were, in part, attributable to enhanced G2/M phase progression, where fewer FlnB deficient ATDC5 chondrocytes resided in the G2/M phase of the cell cycle. FlnB loss reduced Cdk1 phosphorylation (an inhibitor of G2/M phase progression) and Cdk1 inhibition in chondrocytes mimicked the null FlnB, premature differentiation phenotype, through a β1-integrin receptor- Pi3k/Akt (a key regulator of chondrocyte differentiation) mediated pathway. In this context, the early prehypertrophic differentiation provides an explanation for the premature differentiation seen in this disorder, whereas the progressive decline in proliferating chondrocytes would ultimately lead to reduced chondrocyte production and shortened bone length. These findings begin to define a role for filamin proteins in directing both cell proliferation and differentiation through indirect regulation of cell cycle associated proteins.


Conflict of interest statement

Competing Interests: The authors have declared that no competing interests exist.

Figures

Figure 1
Figure 1. Reduced proliferative capacity and enhanced differentiation in FlnB knockdown proliferating chondrocytes.
(A) Fluorescent immunocytochemistry performed on FlnB knockdown ATDC5 (FlnBsh2) chondrocytes shows downregulation of both proliferating chondrocyte markers, Sox9 and Col2a1 in the FlnB knockdown ATDC5 cells. The immunostaining also shows down-regulation of the prehypertrophic markers, Pthr1 and Ihh in the FlnB knocked down cells and increased expression for the hypertrophic marker Col10a1 and chondrocyte differentiation marker Runx2 in FlnBsh2 proliferating chondrocytes. (B) Western blot analyses of FlnBsh2 chondrocytes show a similar increased differentiation of the ATDC5 chondrocytes following FlnB knockdown compared to control. Results are graphically summarized to the right. (C) Alkaline phosphatase assay. Alkaline phosphatase activity was decreased in FlnB knockdown ATDC5 cells. (D) FlnBsh2 chondrocytes undergo a slower growth rate compared to normal ATDC5 cells. Quantification reveals an approximate 64% reduction in the proliferation rate by 5 days in culture. Cells are plated at a density of 1×10⁵ and quantified at daily intervals. (E) Statistical analyses (n≥3 independent samples per experiment) show that the numbers of cells per unit area positively labeled for BrdU, Ki67, and PH3 (red) FlnBsh2 proliferating chondrocytes are decreased by 57%, 46%, and 45%, respectively when compared to control ATDC5 cells. * = p<0.05, ** = p<0.01, *** = p<0.001. Scale bars = 50 µm.
Figure 2
Figure 2. Premature differentiation within the prehypertrophic zone in the long bone growth plates with loss of FlnB function.
(A) Col2a1 and Col10a1 double immunostaining on P1 null FlnB radius shows an abnormally increased region of overlapping expression for the proliferation and hypertrophic markers (open arrow). Quantitative analysis of the length of Col2a1+-Col10a1+ overlapping expression relative to the growth plate length. The Col2a1+-Col10a1+ overlapping region is increased in FlnB−/− mice at P1 and 2 week old age (17.7% vs 8.6%, 24.2% vs 19.1% in FlnB−/− and wild type, respectively). The ratio at P7 shows the similar, albeit not significant, trend of change. At P1, n samples = 6, for P7 and 2 week age, n samples = 3. (B) Pthr1 antibody immunostaining. Pthr1+ zones are thickened in the FlnB−/− radius at P1, P7 and 2 weeks. At 2 weeks, most of the chondrocytes become Pthr1+ in some FlnB−/− mice (open arrow). (C) Ihh antibody immunostaining. Ihh+ zones are thickened in the FlnB−/− radius at P1, P7 and 2 weeks. At 2 weeks, the Ihh+ zone covers both the prehypertrophic and hypertrophic zones in most of the FlnB−/− mice (open arrow). Scale bars = 200 µm.
Figure 3
Figure 3. FlnB−/− mouse chondrocytes display decreased proliferation at postnatal ages.
(A) Immunostaining for Sox9 shows a decrease in the proportion of Sox9+ cells in growth plates of FlnB−/− mice at all detected ages. The data are quantified and graphically summarized to the right. (B) Immunofluorescent photomicrographs of E16.5 FlnB−/− and control radial bone growth plate after immunostaining for proliferation markers: BrdU (fluoroscein), a marker labeling cells entering into S-phase; Ki67 (fluoroscein), a marker for cells in the cell cycle; and phospho-histone H3 (PH3) (fluoroscein), an M-phase marker. Higher magnification images of the outlined boxes are to the right. There is an overall reduction in each of these markers within the proliferative zone after FlnB knockout at various ages. Statistical analyses (n≥3 independent samples per experiment) shows that the percentage of cells positively labeled for Sox9, BrdU, Ki67, and PH3 in FlnB−/− cortex is decreased, respectively when compared to littermate controls. * = p<0.05, ** = p<0.01, *** = p<0.001 by t-test. Scale bar = 200 µm for low magnification; 50 µm for high magnification.
Figure 4
Figure 4. Increased proliferating chondrocytes remaining in G1/G0 phase in null FlnB.
(A) Co-staining for Ki67 (fluoroscein) and BrdU (rhodamine) in vivo demonstrates an increase in the number of proliferating chondrocytes in the FlnB−/− radius that remain in G1/G0 phase, consistent with an increased rate of differentiation. BrdU is given as a single pulse to capture the proliferating progenitors. After 48 hours, the animal is sacrificed and co-staining is performed with Ki67 (a marker of all proliferating cells). BrdU positive progenitors, which remain as progenitors will be Ki67 positive (Ki67hi), whereas those are undergoing differentiation (remain in G1 phase) or having been differentiated (remain in G0 phase) will be Ki67 weak/negative (Ki67−/low). Higher magnification photomicrographs of the boxed images are shown to the right and demonstrate the reduction in BrdU+ proliferating chondrocytes, which remain Ki67hi after 48 hours with loss of FlnB. (B) Cultured primary null FlnB proliferating chondrocytes show a similar reduction in levels of BrdU (fluoroscein) and Ki67 (rhodamine) immunolabeling. The FlnB null proliferating chondrocytes from the culture studies also show an increase in the number of cells that remaining in G1/G0 phase (BrdU+, Ki67−/low), similar to that seen in vivo. (C) and (D) Quantification of the chondrocytes remaining in G1/G0 phase in vivo and in vitro. The analyses show an increase of approximately 10% and 13% of BrdU+ FlnB null chondrocytes remaining in G1/G0 phase in the E16.5 and P7 radial bone, respectively (C) and an increase of approximately 36% of BrdU+ FlnB null chondrocytes remaining in G1/G0 phase in vitro (D). * = p<0.05, ** = p<0.01, *** = p<0.001. Scale bar = 200 µm for low magnification and 25 µm for high magnification in A; 50 µm in B.
Figure 5
Figure 5. Dysregulation of Cyclin B-associated proteins with loss of FlnB function.
(A) Flow cytometry following propridium iodide (PI) labeling demonstrates a decrease in the number of FlnBsh2 chondrocytes that reside in G2/M phase and an increase in the number of cells that reside in G1/G0 phase, compared to ATDC5 control cells. (B) Western blot analyses similarly shows a reduction in these Cyclin B1-associated markers, including Cyclin B1, Cdc20, Cdc25c, Pkmyt1, 14-3-3, and Wee1, within the FlnB knockdown ATDC5 cells. Cdk1 levels are largely unchanged but Cdk1 phosphorylation (pY15) is diminished. G2/M phase progression is mediated by Cdk1 activation (phosphorylation) through the Cyclin B1-associated proteins. Reduced Cdk1 phosphorylation promotes progression through G2/M phase. Changes in Western blot intensity for various proteins expression are quantified below. (C) A corresponding decrease in both the rhodamine fluorescence intensity and number of labeled FlnBsh2 proliferating chondrocytes is seen using various G2/M phase markers, including Cyclin B1, Cdc20, and Cdc25c (rhodamine). Additional markers are shown in supplementary figure S5. * = p<0.05, *** = p<0.001. Scale bar = 50 µm in C.
Figure 6
Figure 6. Cdk1 inhibition reproduces the loss of FlnB phenotypes.
(A) Following inhibition of Cdk1 activity, ATDC5 progenitors undergo a slower growth rate compared to untreated ATDC5 controls. Proliferation capacity is dramatically decreased at low concentrations of Cdk1 inhibitor (1 µM) and in the absence of any observed increase in cell death. (B) Flow cytometry following propridium iodide (PI) labeling shows a decrease in the number of ATDC5 cells in G2/M phase and an increase in the number of ATDC5 cells in G1/G0 phase in the Cdk1 inhibitor (1 µM) treated cells compared to control. (C) All the cell cycle markers, Cdk1(pY15), Cyclin B1, Cdc20 and Cdc25c, are downregulated following Cdk1 inhibitor treatment, with the exception of total Cdk1 protein levels. Quantification graph is shown to the right. As seen with loss of FlnB function, inhibition of Cdk1 activity (phosphorylation) leads to a decline in early progenitor markers Sox9 and Col2a1, and upregulation of hypertrophic markers Col10a1 and Runx2. Quantitative changes are shown graphically to the right. * = p<0.05, ** = p<0.01, *** = p<0.001.
Figure 7
Figure 7. Loss of FlnB induces Cdk1 activity changes through β1 integrin-Pi3k/Akt pathway.
(A, B) Immunostaining of total and phospho-β1 integrin (pS785)(postnatal day 1 radius). Phospho-β1 integrin (pS785) levels are down-regulated in FlnB knockout chondrocytes (arrows) (B). (C, E) Western blotting results show that Pi3k(p85 subunit) and phospho-Akt(pS473), as well as phospho-Cdk1(pY15) are down-regulated in FlnB knockdown (Bsh) ATDC5 cells. Total Akt levels are not changed. Total β1 integrin levels are up-regulated but phospho-β1 integrsin (pS785) are down-regulated. Results are quantified in (E). (D, F) β1 integrin activation (Itgb1) in ATDC5 cells regulates Pi3k/Akt and Cdk1 activation. Pretreatment of ATCD5 cells with fibronectin and laminin I but not collagen (col) induces up-regulation of total β1 integrin levels but down-regulation of phospho-β1 integrin (pS785) levels. Pi3k, pAkt and Cdk1(pY15) levels are down-regulated by fibronectin and laminin I. Total Akt levels are not changed. ATDC5 cells are incubated in the presence of extracellular matrix molecules: fibronectin, laminin, and collagen, which serve as ligands for the β1 integrin receptor, and activation of the downstream pathways are assessed by Western blot analyses. Con = control, Col = collagen, Fib = fibronectin, and Lam = laminin. (G) Pretreatment of ATDC5 cells with Akt inhibitor VIII decreases Akt(pS473), Cdk1(pY15) and Sox9 levels, but increases protein levels of hypertrophic markers such as Runx2 and Col0a1. * = p<0.05, ** = p<0.01, *** = p<0.001; ## = p<0.01, ### = p<0.001. Star sign (*) represents comparison with control groups. (#) represents comparison between FlnA knockdown groups and FlnB knockdown groups. Scale bars = 200 µm, in A and B.

Similar articles

Cited by

References

    1. Bicknell LS, Farrington-Rock C, Shafeghati Y, Rump P, Alanay Y, et al. (2007) A molecular and clinical study of Larsen syndrome caused by mutations in FLNB. J Med Genet 44: 89–98. - PMC - PubMed
    1. Bicknell LS, Morgan T, Bonafe L, Wessels MW, Bialer MG, et al. (2005) Mutations in FLNB cause boomerang dysplasia. J Med Genet 42: e43. - PMC - PubMed
    1. Farrington-Rock C, Firestein MH, Bicknell LS, Superti-Furga A, Bacino CA, et al. (2006) Mutations in two regions of FLNB result in atelosteogenesis I and III. Hum Mutat 27: 705–710. - PubMed
    1. Krakow D, Robertson SP, King LM, Morgan T, Sebald ET, et al. (2004) Mutations in the gene encoding filamin B disrupt vertebral segmentation, joint formation and skeletogenesis. Nat Genet 36: 405–410. - PubMed
    1. Farrington-Rock C, Kirilova V, Dillard-Telm L, Borowsky AD, Chalk S, et al. (2008) Disruption of the Flnb gene in mice phenocopies the human disease spondylocarpotarsal synostosis syndrome. Hum Mol Genet 17: 631–641. - PMC - PubMed

Publication types

MeSH terms