. 2014 Jan 15;7(2):481-95.
eCollection 2014.

Requirement for TLR2 in the development of albuminuria, inflammation and fibrosis in experimental diabetic nephropathy

Affiliations

Requirement for TLR2 in the development of albuminuria, inflammation and fibrosis in experimental diabetic nephropathy

Jin Ma et al. Int J Clin Exp Pathol. .

Abstract

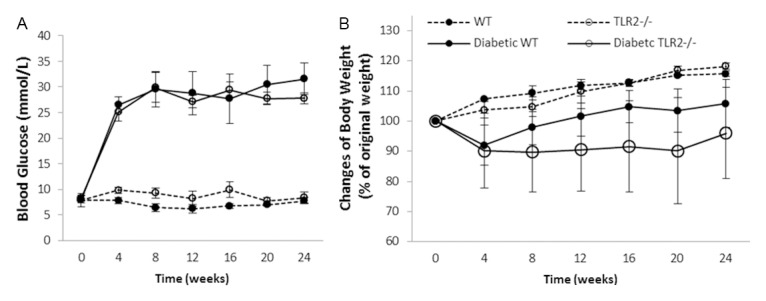
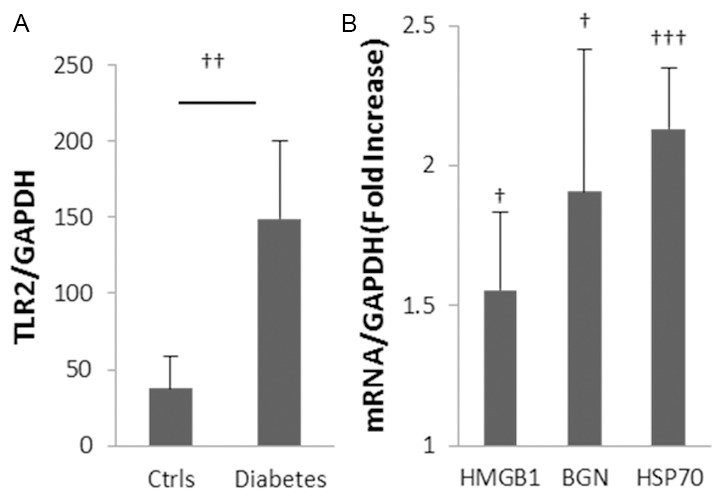
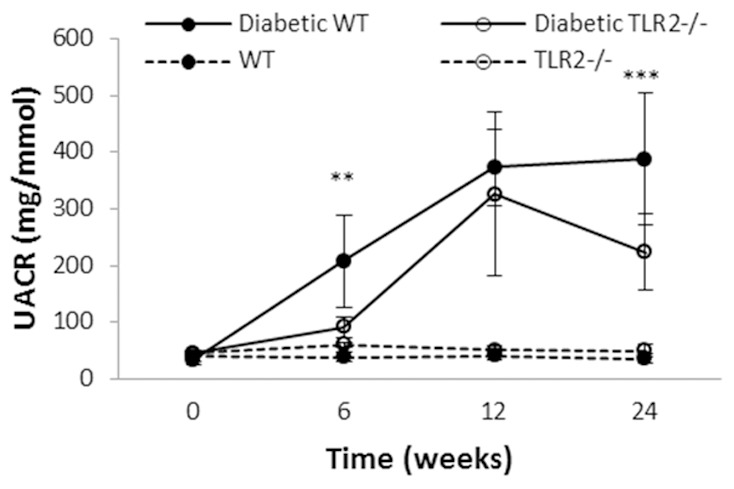
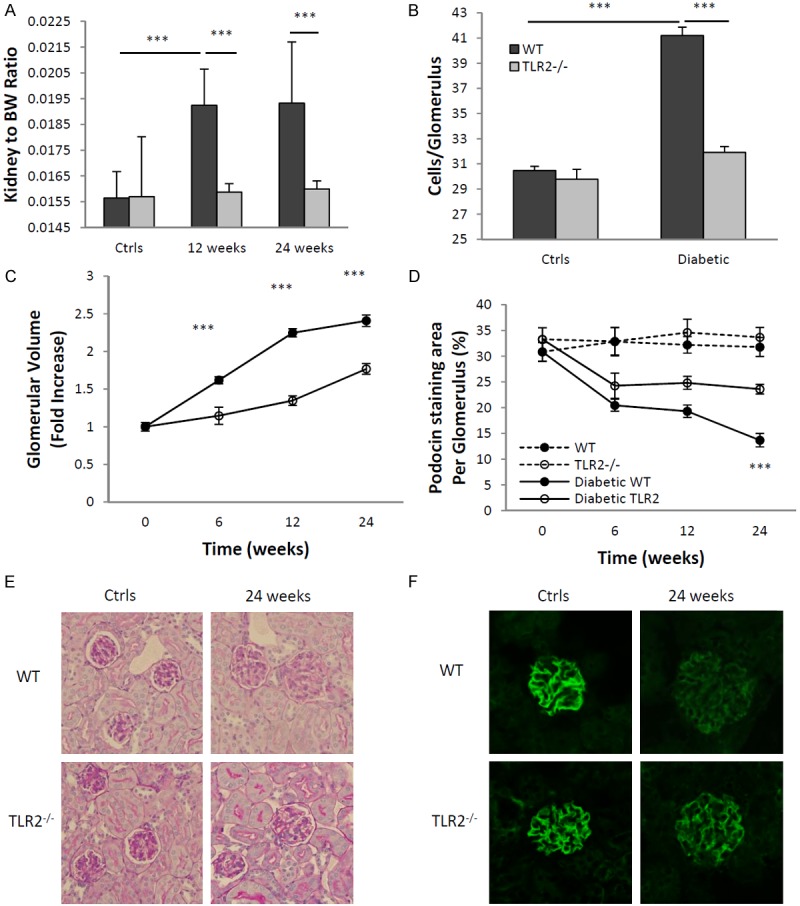
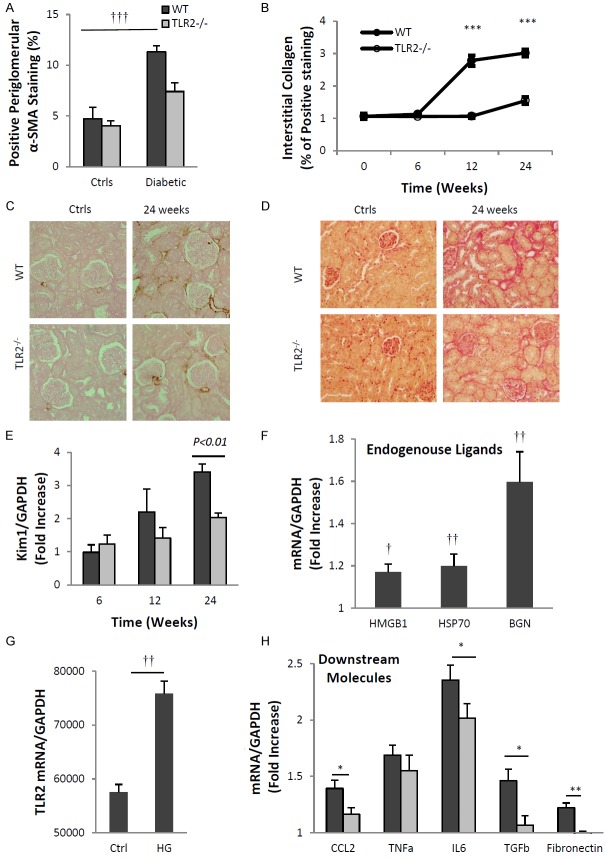
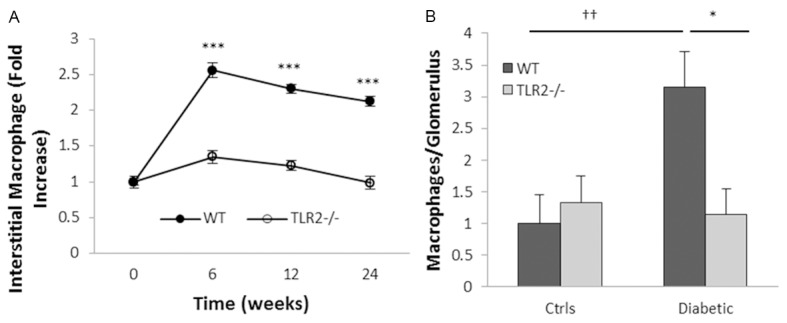
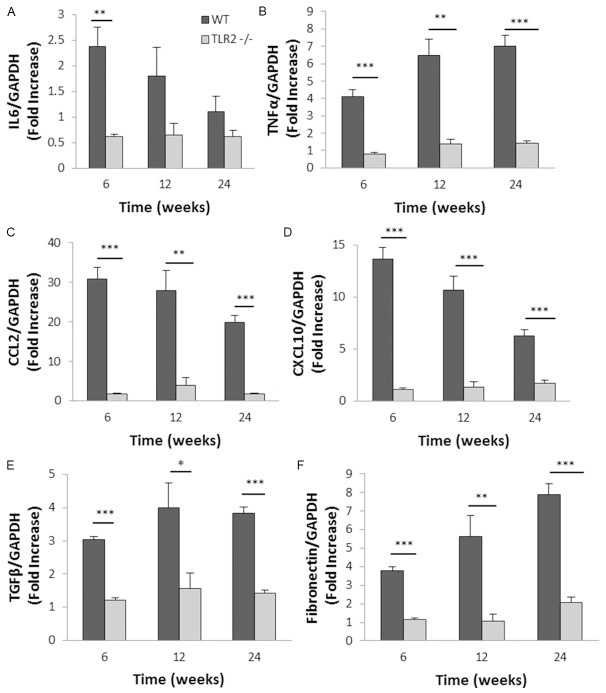
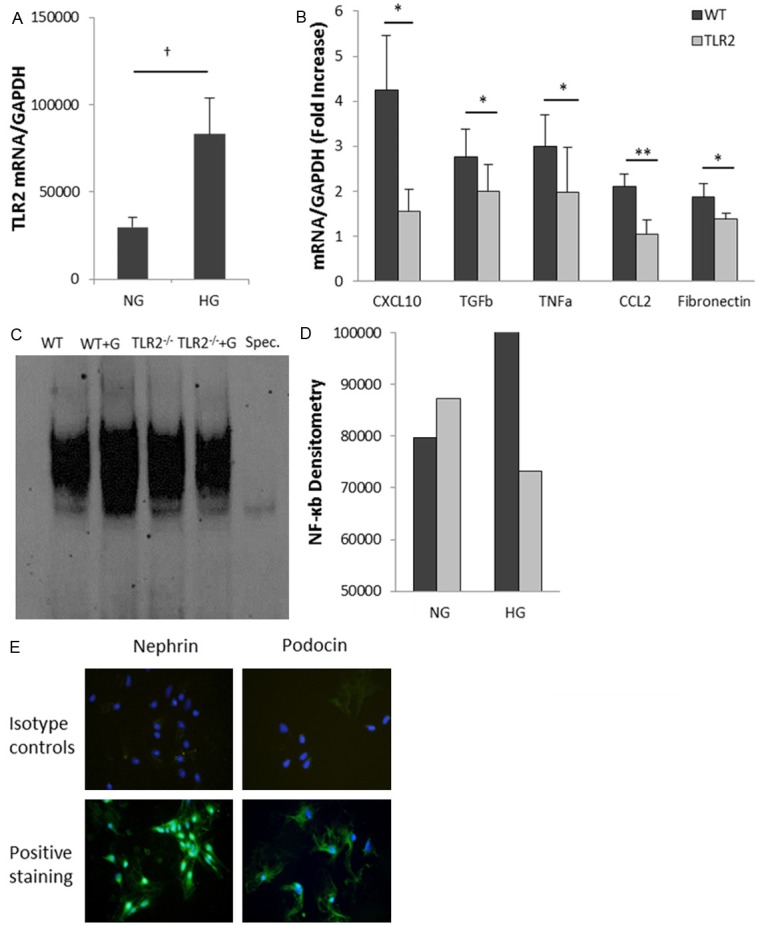
Inflammation and fibrosis are essential elements of diabetic nephropathy (DN). We tested the hypothesis that these elements are dependent upon Toll-like receptor 2 (TLR2) signalling by examining WT and TLR2(-/-) mice in an experimental model of DN. Diabetes was induced in WT and TLR2(-/-) mice by i.p. injection of streptozotocin. Kidney injury was assessed at 6, 12 and 24 weeks after induction of diabetes. Gene expression of TLR2, its endogenous ligands and downstream cytokines, chemokines and fibrogenic molecules were upregulated in kidneys from WT mice with streptozotocin diabetes. TLR2(-/-) mice were protected against the development of DN, exhibiting less albuminuria, inflammation, glomerular hypertrophy and hypercellularity, podocyte and tubular injury as compared to diabetic WT controls. Marked reductions in interstitial collagen deposition, myofibroblast activation (α-SMA) and expression of fibrogenic genes (TGF-β and fibronectin) were also evident in TLR2 deficient mice. Consistent with our in vivo results, high glucose directly promoted TLR2 activation in podocytes and tubular epithelial cells (TECs) in vitro, resulting in NF-κB activation, inflammation and TGF-β production. We conclude that TLR2 was required for the full development of inflammation, kidney damage and fibrosis in this model of DN. As TLR2 is known to be expressed by intrinsic kidney cells and as high concentration glucose stimulated podocytes and TECs in vitro to express TLR2 and TLR2 ligands, pro-inflammatory and pro-fibrotic cytokines in a TLR2 dependent manner in the present study, it appears likely that TLR2 signalling in intrinsic kidney cells contributes to the pathogenesis of diabetic nephropathy.

Keywords: Diabetic nephropathy; Toll like receptor 2; fibrosis; podocytes.


Figures

Figure 1
Figure 1
Both WT and TLR2-/- mice developed diabetes. STZ treatment induced diabetes to WT and TLR2-/- mice with similar severity as indicated by changes in blood glucose (A) and body weight (B) over a period of 24 weeks where WT n=12 and TLR2-/- n=9 for week 6 time point; WT n=10 and TLR2-/- n=8 for week 12 time point and WT n=12 and TLR2-/- n=8 for week 24 time point in diabetic groups, while age matched non-diabetic controls were 5 mice per group. Data are shown as mean ± SD.
Figure 2
Figure 2
Up-regulation of TLR2 and endogenous ligands in diabetic nephropathy. Gene expression of TLR2 and its ligands were up-regulated in kidney at 10 weeks after initiation of diabetes with STZ (A, B). Data are shown as mean ± SD; †P<0.05 WT diabetic vs. non-diabetic; ††P<0.01 WT diabetic vs. non-diabetic; †††P<0.001 WT diabetic vs. non-diabetic n=7 per group.
Figure 3
Figure 3
TLR2 deficiency provides partial protection against albuminuria in diabetic nephropathy. Progressive albuminuria was seen in diabetic mice as compared to controls, however among mice with diabetes, TLR2-/- mice developed significantly less albuminuria than WT. Data are shown as mean ± SD; **P<0.01 WT diabetic vs. TLR2-/- diabetic; ***P<0.001 WT diabetic vs. TLR2-/- diabetic. The number of animals per group was defined in Figure 1.
Figure 4
Figure 4
Glomerular enlargement and podocyte injury caused by diabetes were attenuated in the absence of TLR2. TLR2-/- mice with diabetes were relatively protected from development of diabetic nephropathy as compared to WT mice with diabetes, as assessed by glomerular hypertrophy indicated by increased kidney to bodyweight ratio (A) glomerular hyper-cellularity (B) and glomerular volume (C). Podocyte damage was also less severe in TLR2-/- mice with diabetes, as assessed by decreased podocin staining (D, F). (E) Representative sections of glomeruli from WT and TLR2-/-, diabetic and non diabetic mice (PAS stained, × 400). (F) Representative sections of glomeruli stained for podocin at different time points are shown, with the top panels showing reduction of podocin in WT mice with diabetes, which was less pronounced in TLR2-/- mice with diabetes (bottom panels). The data shown are the means ± SEM; ***P<0.001 WT diabetic vs. TLR2-/- diabetic; †††P<0.001 WT diabetic vs. non-diabetic. The number of animals per group was defined in Figure 1.
Figure 5
Figure 5
TLR2 deficiency was protective against diabetic tubular injury and fibrosis. TLR2 deficiency protected diabetic kidneys from interstitial fibrosis and tubular injuries. (A) As compared to non-diabetic controls, α-SMA expression was increased in WT but not TLR2-/- kidneys as assessed by IHC. (C) Representative sections are shown with α-SMA over-expression in WT diabetic kidney (top panels), which was reduced in TLR2-/- diabetic kidney (bottom panels). (B) Interstitial collagen expression was significantly up-regulated at 12 and 24 weeks in diabetic WT kidneys compared with diabetic TLR2-/- kidneys. (D) Representative sections of PSR staining in WT (top panels) and TLR2-/- (bottom panels) diabetic kidney. (E) Significant up-regulation of KIM-1 in WT diabetic kidney indicated tubular injury, which was attenuated in TLR2-/- diabetic kidneys. Primary TECs from WT mice and TLR2-/- mice were cultured with normal glucose (NG) (5.5 mM glucose + 24.5 mM mannitol) or high glucose (HG) (5.5 mM glucose + 24.5 mM glucose) for 12 hours. Under high glucose conditions TECs displayed up-regulation of TLR2 (G), its endogenous ligands (F) and downstream effectors, among which CCL2, IL6 and TGF-β were significant supressed by TLR2 deficiency (H). Data are shown as mean ± SEM; *P<0.05 WT HG vs. TLR2-/- HG; **P<0.01 WT HG vs. TLR2-/- HG; ***P<0.001 WT diabetic vs. TLR2-/- diabetic; †P<0.05 WT NG vs. HG; ††P<0.01 WT NG vs. HG; †††P<0.001 WT diabetic vs. non-diabetic. The number of animals per group was defined in Figure 1.
Figure 6
Figure 6
TLR2 deficiency ameliorated macrophage accumulation in diabetic kidneys (A) Interstitial and (B) glomerular CD68+ macrophage accumulation was evident in WT but not TLR2 deficient mice with diabetes. Data are present as mean ± SEM. *P<0.05 WT diabetic vs. TLR2-/- diabetic; ***P<0.001 WT diabetic vs. TLR2-/- diabetic; ††P<0.01 WT diabetic vs. non-diabetic. The number of animals per group was defined in Figure 1.
Figure 7
Figure 7
TLR2 deficiency reduced inflammatory and fibrotic gene expression in diabetic kidneys. RT-PCR demonstrated substantial up-regulation of mRNA expression of IL6 (A), TNF-α (B), CCL2 (C), CXCL10 (D), TGF-β (E) and fibronectin (F) in WT diabetic kidneys, all of which were markedly diminished by deficiency of TLR2. Data are shown as means ± SEM. *P<0.05 WT diabetic vs. TLR2-/- diabetic **P<0.01 WT diabetic vs. TLR2-/- diabetic; ***P<0.001 WT diabetic vs. TLR2-/- diabetic. The number of animals per group was defined in Figure 1.
Figure 8
Figure 8
High concentration glucose induces activation of pro-inflammatory pathways in podocytes via TLR2. Primary podocytes from WT mice and TLR2-/- mice were cultured with normal glucose (5.5 mM glucose + 24.5 mM mannitol) or high glucose (5.5 mM glucose + 24.5 mM glucose) for 12 hours. (A) Real-time PCR analysis demonstrated that high glucose concentration induced up-regulation of TLR2 (A) and its downstream molecules (B). High-glucose-induced up-regulation of these molecules was significantly reduced in podocytes derived from TLR2-/- mice. (C, D) NF-κB DNA binding activity was increased in WT podocytes after high glucose stimulation for 12 hours compared with osmotic controls, but not in TLR2-/- podocytes. Primary podocyte cultures were defined by positive staining for the podocyte markers podocin and nephrin (E). Data are shown as means ± SEM; *P<0.05 WT HG vs. TLR2-/- HG **P<0.001 WT HG vs. TLR2-/- HG; †P<0.05 WT NG vs. HG.

References

    1. Hovind P, Tarnow L, Rossing K, Rossing P, Eising S, Larsen N, Binder C, Parving HH. Decreasing incidence of severe diabetic microangiopathy in type 1 diabetes. Diabetes Care. 2003;26:1258–1264. - PubMed
    1. White SL, Cass A, Atkins RC, Chadban SJ. Chronic kidney disease in the general population. Adv Chronic Kidney Dis. 2005;12:5–13. - PubMed
    1. de Boer IH, Rue TC, Hall YN, Heagerty PJ, Weiss NS, Himmelfarb J. Temporal trends in the prevalence of diabetic kidney disease in the United States. JAMA. 2011;305:2532–2539. - PMC - PubMed
    1. Weil EJ, Lemley KV, Mason CC, Yee B, Jones LI, Blouch K, Lovato T, Richardson M, Myers BD, Nelson RG. Podocyte detachment and reduced glomerular capillary endothelial fenestration promote kidney disease in type 2 diabetic nephropathy. Kidney Int. 2012;82:1010–1017. - PMC - PubMed
    1. Lim AKH, Tesch GH. Inflammation in Diabetic Nephropathy. Mediators Inflamm. 2012;2012:12. - PMC - PubMed

Publication types

MeSH terms