

Method for the development of data visualizations for community members with varying levels of health literacy
- PMID: 24551322
- PMCID: PMC3900122
Method for the development of data visualizations for community members with varying levels of health literacy
Abstract
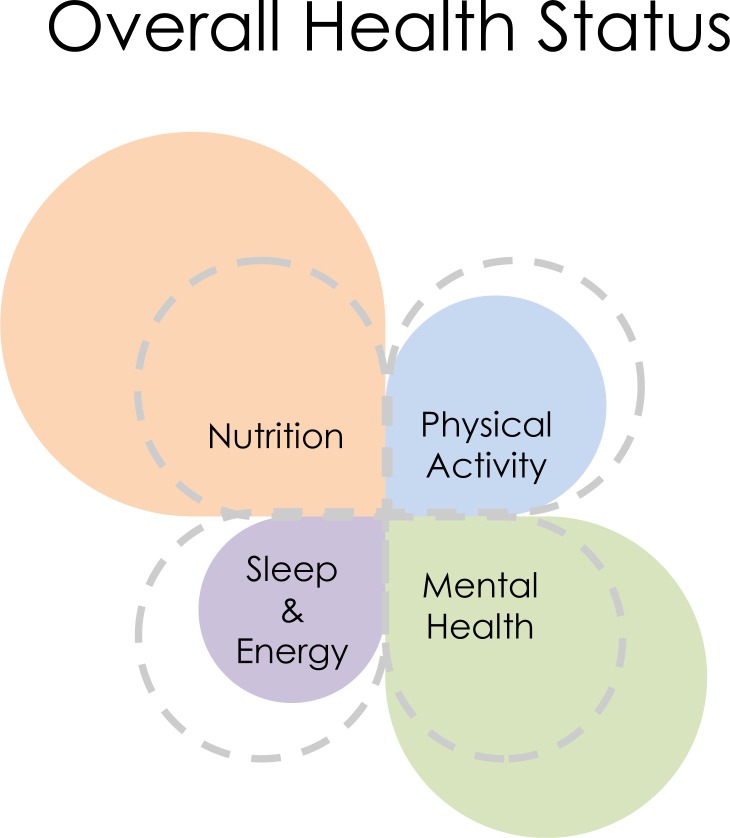
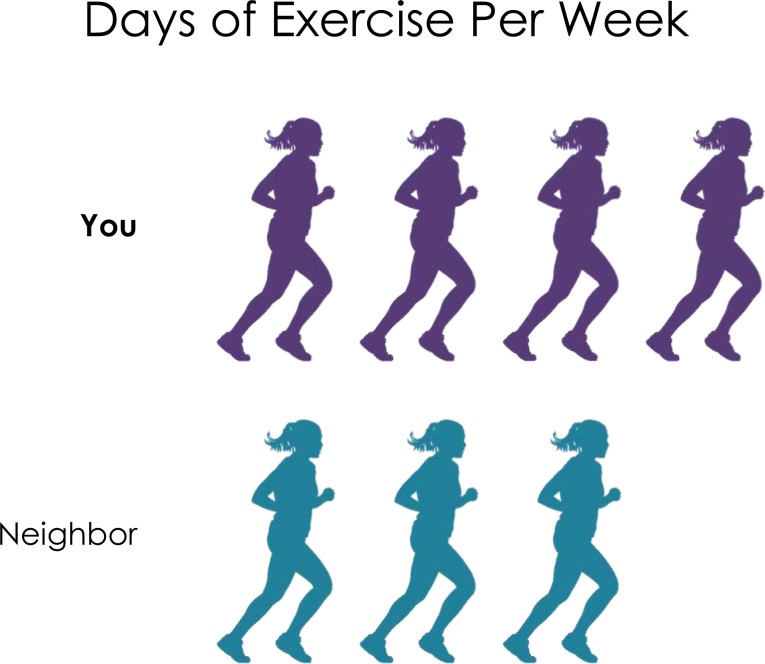
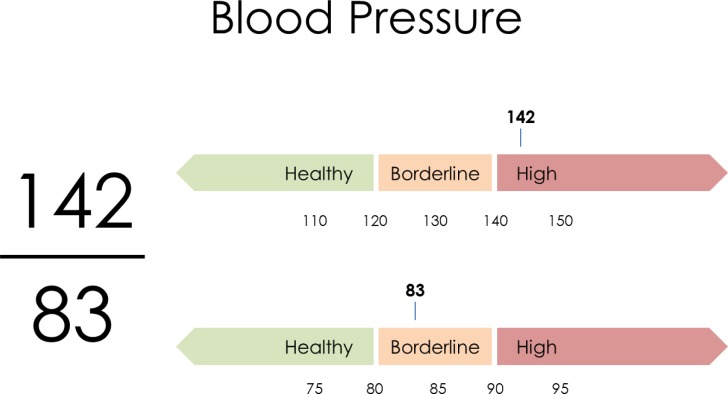
Many Americans are challenged by the tasks of understanding and acting upon their own health data. Low levels of health literacy contribute to poor comprehension and undermine the confidence necessary for health self-management. Visualizations are useful for minimizing comprehension gaps when communicating complex quantitative information. The process of developing visualizations that accommodate the needs of individuals with varying levels of health literacy remains undefined. In this paper we provide detailed descriptions of a) an iterative methodological approach to the development of visualizations, b) the resulting types of visualizations and examples thereof, and c) the types of data the visualizations will be used to convey. We briefly describe subsequent phases in which the visualizations will be tested and refined. Web deployment of the final visualizations will support the ethical obligation to return the data to the research participants and community that contributed it.
Figures
Similar articles
-
Sometimes more is more: iterative participatory design of infographics for engagement of community members with varying levels of health literacy.J Am Med Inform Assoc. 2016 Jan;23(1):174-83. doi: 10.1093/jamia/ocv079. Epub 2015 Jul 13. J Am Med Inform Assoc. 2016. PMID: 26174865 Free PMC article.
-
Comprehension, utility, and preferences of prostate cancer survivors for visual timelines of patient-reported outcomes co-designed for limited graph literacy: meters and emojis over comics.J Am Med Inform Assoc. 2022 Oct 7;29(11):1838-1846. doi: 10.1093/jamia/ocac148. J Am Med Inform Assoc. 2022. PMID: 36040190 Free PMC article.
-
Promoting Latino Self-Management Through Use of Information Visualizations: A Case Study in New York City.Stud Health Technol Inform. 2020 Jun 25;269:153-160. doi: 10.3233/SHTI200029. Stud Health Technol Inform. 2020. PMID: 32593990
-
A scoping review of the use of visual aids in health education materials for persons with low-literacy levels.Patient Educ Couns. 2021 May;104(5):998-1017. doi: 10.1016/j.pec.2020.11.034. Epub 2020 Nov 27. Patient Educ Couns. 2021. PMID: 33339657
-
A Systematic Review of Patient-Facing Visualizations of Personal Health Data.Appl Clin Inform. 2019 Aug;10(4):751-770. doi: 10.1055/s-0039-1697592. Epub 2019 Oct 9. Appl Clin Inform. 2019. PMID: 31597182 Free PMC article.
Cited by
-
Leveraging Patient-Reported Outcomes Using Data Visualization.Appl Clin Inform. 2018 Jul;9(3):565-575. doi: 10.1055/s-0038-1667041. Epub 2018 Aug 1. Appl Clin Inform. 2018. PMID: 30068012 Free PMC article.
-
Style Guide: An Interdisciplinary Communication Tool to Support the Process of Generating Tailored Infographics From Electronic Health Data Using EnTICE3.EGEMS (Wash DC). 2015 Jan 26;3(1):1120. doi: 10.13063/2327-9214.1120. eCollection 2015. EGEMS (Wash DC). 2015. PMID: 25848634 Free PMC article.
-
Sometimes more is more: iterative participatory design of infographics for engagement of community members with varying levels of health literacy.J Am Med Inform Assoc. 2016 Jan;23(1):174-83. doi: 10.1093/jamia/ocv079. Epub 2015 Jul 13. J Am Med Inform Assoc. 2016. PMID: 26174865 Free PMC article.
-
Do health information technology self-management interventions improve glycemic control in medically underserved adults with diabetes? A systematic review and meta-analysis.J Am Med Inform Assoc. 2017 Sep 1;24(5):1024-1035. doi: 10.1093/jamia/ocx025. J Am Med Inform Assoc. 2017. PMID: 28379397 Free PMC article.
-
Integrating Community-Based Participatory Research Into Cardiac Clinical Trials: Lessons From REVASCHOICE.JACC Adv. 2025 Jun;4(6 Pt 1):101799. doi: 10.1016/j.jacadv.2025.101799. Epub 2025 May 13. JACC Adv. 2025. PMID: 40367759 Free PMC article.
References
-
- Nutbeam D. Health literacy as a public health goal: a challenge for contemporary health education and communication strategies into the 21st century. Health Promot Int. 2000;15(3):259–267.
Publication types
MeSH terms
Grants and funding
LinkOut - more resources
Full Text Sources
Medical