

Spectral Analysis of EEG in Familial Alzheimer's Disease with E280A Presenilin-1 Mutation Gene
- PMID: 24551475
- PMCID: PMC3914466
- DOI: 10.1155/2014/180741
Spectral Analysis of EEG in Familial Alzheimer's Disease with E280A Presenilin-1 Mutation Gene
Abstract
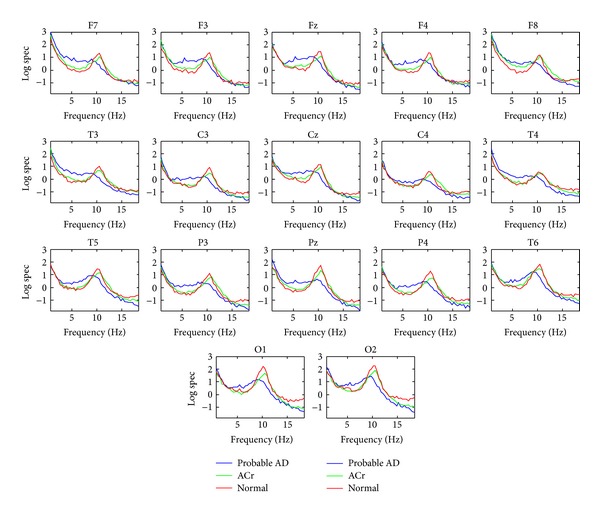
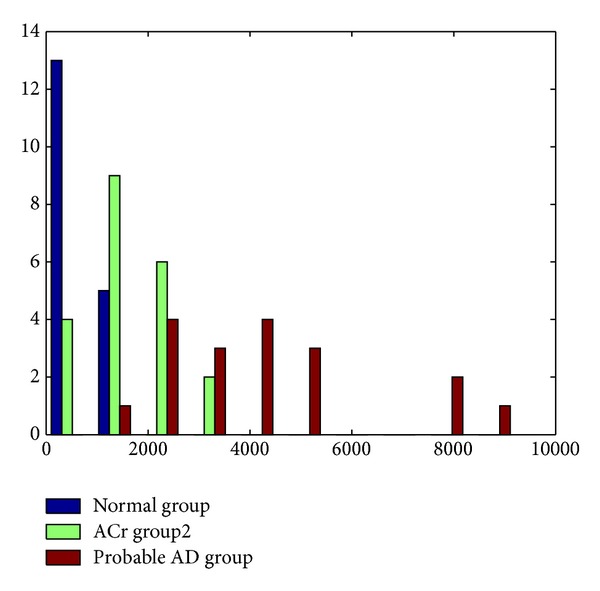
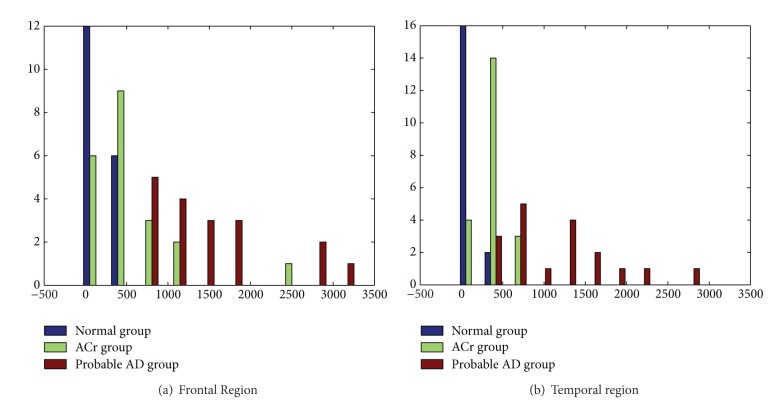
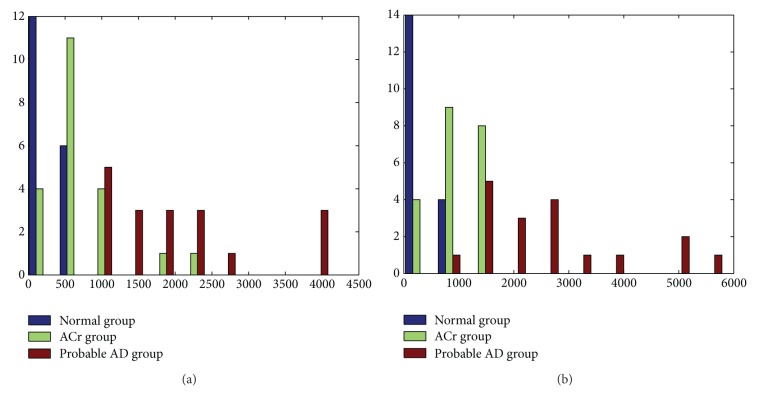
To evaluate the hypothesis that quantitative EEG (qEEG) analysis is susceptible to detect early functional changes in familial Alzheimer's disease (AD) preclinical stages. Three groups of subjects were selected from five extended families with hereditary AD: a Probable AD group (18 subjects), an asymptomatic carrier (ACr) group (21 subjects), with the mutation but without any clinical symptoms of dementia, and a normal group of 18 healthy subjects. In order to reveal significant differences in the spectral parameter, the Mahalanobis distance (D (2)) was calculated between groups. To evaluate the diagnostic efficiency of this statistic D (2), the ROC models were used. The ROC curve was summarized by accuracy index and standard deviation. The D (2) using the parameters of the energy in the fast frequency bands shows accurate discrimination between normal and ACr groups (area ROC = 0.89) and between AD probable and ACr groups (area ROC = 0.91). This is more significant in temporal regions. Theses parameters could be affected before the onset of the disease, even when cognitive disturbance is not clinically evident. Spectral EEG parameter could be firstly used to evaluate subjects with E280A Presenilin-1 mutation without impairment in cognitive function.
Figures
Similar articles
-
Pre-dementia clinical stages in presenilin 1 E280A familial early-onset Alzheimer's disease: a retrospective cohort study.Lancet Neurol. 2011 Mar;10(3):213-20. doi: 10.1016/S1474-4422(10)70323-9. Epub 2011 Feb 4. Lancet Neurol. 2011. PMID: 21296022
-
Precuneus Failures in Subjects of the PSEN1 E280A Family at Risk of Developing Alzheimer's Disease Detected Using Quantitative Electroencephalography.J Alzheimers Dis. 2017;58(4):1229-1244. doi: 10.3233/JAD-161291. J Alzheimers Dis. 2017. PMID: 28550254
-
Mental Disorders in Young Adults from Families with the Presenilin-1 Gene Mutation E280A in the Preclinical Stage of Alzheimer's Disease.J Alzheimers Dis Rep. 2019 Aug 29;3(1):241-250. doi: 10.3233/ADR-190139. J Alzheimers Dis Rep. 2019. PMID: 31754656 Free PMC article.
-
Biological and Cognitive Markers of Presenilin1 E280A Autosomal Dominant Alzheimer's Disease: A Comprehensive Review of the Colombian Kindred.J Prev Alzheimers Dis. 2019;6(2):112-120. doi: 10.14283/jpad.2019.6. J Prev Alzheimers Dis. 2019. PMID: 30756118 Free PMC article. Review.
-
Phenotypic profile of early-onset familial Alzheimer's disease caused by presenilin-1 E280A mutation.J Alzheimers Dis. 2012;32(1):1-12. doi: 10.3233/JAD-2012-120907. J Alzheimers Dis. 2012. PMID: 22766738 Review.
Cited by
-
Functional network disruption in cognitively unimpaired autosomal dominant Alzheimer's disease: a magnetoencephalography study.Brain Commun. 2024 Nov 25;6(6):fcae423. doi: 10.1093/braincomms/fcae423. eCollection 2024. Brain Commun. 2024. PMID: 39713236 Free PMC article.
-
Systematic Review on Resting-State EEG for Alzheimer's Disease Diagnosis and Progression Assessment.Dis Markers. 2018 Oct 4;2018:5174815. doi: 10.1155/2018/5174815. eCollection 2018. Dis Markers. 2018. PMID: 30405860 Free PMC article.
-
Cognitive Decline in a Colombian Kindred With Autosomal Dominant Alzheimer Disease: A Retrospective Cohort Study.JAMA Neurol. 2016 Apr;73(4):431-8. doi: 10.1001/jamaneurol.2015.4851. JAMA Neurol. 2016. PMID: 26902171 Free PMC article.
-
Dantrolene, a treatment for Alzheimer disease?Alzheimer Dis Assoc Disord. 2015 Jan-Mar;29(1):1-5. doi: 10.1097/WAD.0000000000000076. Alzheimer Dis Assoc Disord. 2015. PMID: 25551862 Free PMC article. Review.
-
Successful Object Encoding Induces Increased Directed Connectivity in Presymptomatic Early-Onset Alzheimer's Disease.J Alzheimers Dis. 2017;55(3):1195-1205. doi: 10.3233/JAD-160803. J Alzheimers Dis. 2017. PMID: 27792014 Free PMC article.
References
-
- Robles A, del Ser T, Alom J, Peña-Casanova J. Propuesta de criterios para el diagnóstico clínico del deterioro cognitivo ligero, la demencia y la Enfermedad de Alzheimer. Neurologia. 2002;17:17–32. - PubMed
-
- Jeong J. EEG dynamics in patients with Alzheimer’s disease. Clinical Neurophysiology. 2004;115(7):1490–1505. - PubMed
-
- Braak H, Braak E. Diagnostic criteria for neuropathologic assessment of Alzheimer’s disease. Neurobiology of Aging. 1997;18(4):S85–S88. - PubMed
-
- Grober E, Dickson D, Sliwinski MJ, et al. Memory and mental status correlates of modified Braak staging. Neurobiology of Aging. 1999;20(6):573–579. - PubMed
-
- Mayeux R. Early Alzheimer’s disease. The New England Journal of Medicine. 2010;362(23):2194–2201. - PubMed
Grants and funding
LinkOut - more resources
Full Text Sources
Other Literature Sources
Medical
