

Adolescents with clinical type 1 diabetes display reduced red blood cell glucose transporter isoform 1 (GLUT1)
- PMID: 24552568
- PMCID: PMC4208912
- DOI: 10.1111/pedi.12127
Adolescents with clinical type 1 diabetes display reduced red blood cell glucose transporter isoform 1 (GLUT1)
Abstract
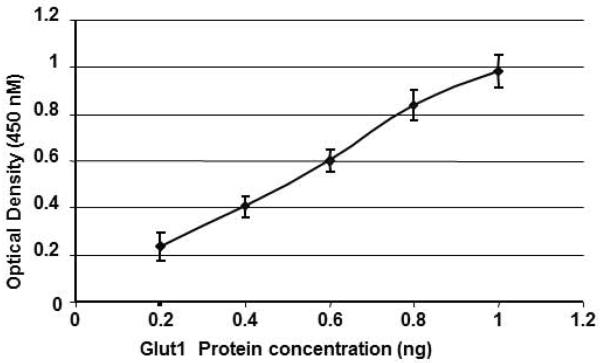
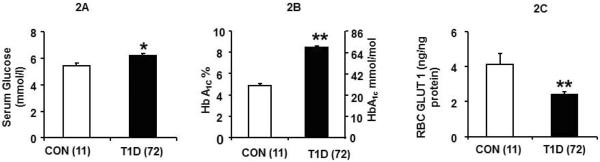
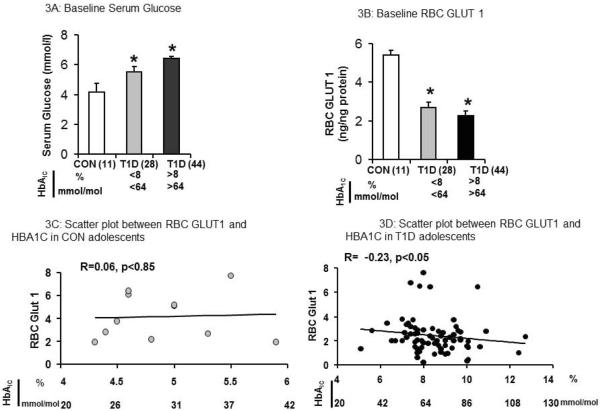
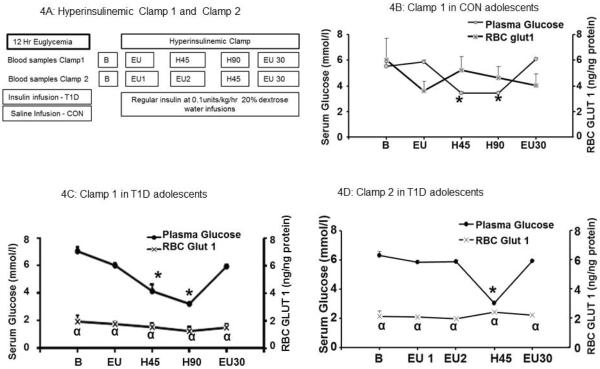
Type 1 diabetic (T1D) adolescent children on insulin therapy suffer episodes of both hyper- and hypoglycemic episodes. Glucose transporter isoform GLUT1 expressed in blood-brain barrier (BBB) and red blood cells (RBC) compensates for perturbed circulating glucose toward protecting the supply to brain and RBCs. We hypothesized that RBC-GLUT1 concentration, as a surrogate for BBB-GLUT1, is altered in T1D children. To test this hypothesis, we measured RBC-GLUT1 by enzyme-linked immunosorbent assay (ELISA) in T1D children (n = 72; mean age 15.3 ± 0.2 yr) and control children (CON; n = 11; mean age 15.6 ± 0.9 yr) after 12 h of euglycemia and during a hyperinsulinemic-hypoglycemic clamp with a nadir blood glucose of ~3.3 mmol/L for 90 min (clamp I) or ~3 mmol/L for 45 min (clamp II). Reduced baseline RBC-GLUT1 was observed in T1D (2.4 ± 0.17 ng/ng membrane protein); vs. CON (4.2 ± 0.61 ng/ng protein) (p < 0.0001). Additionally, baseline RBC-GLUT1 in T1D negatively correlated with hemoglobin A1c (HbA1c) (R = -0.23, p < 0.05) but not in CON (R = 0.06, p < 0.9). Acute decline in serum glucose to 3.3 mmol/L (90 min) or 3 mmol/L (45 min) did not change baseline RBC-GLUT1 in T1D or CON children. We conclude that reduced RBC-GLUT1 encountered in T1D, with no ability to compensate by increasing during acute hypoglycemia over the durations examined, may demonstrate a vulnerability of impaired RBC glucose transport (serving as a surrogate for BBB), especially in those with the worst control. We speculate that this may contribute to the perturbed cognition seen in T1D adolescents.
Keywords: BBB; RBC glucose transporter 1; T1D; hyperinsulinemic clamp; hypoglycemic clamp.
© 2014 John Wiley & Sons A/S. Published by John Wiley & Sons Ltd.
Figures
Similar articles
-
Blood-brain barrier glucose transporter: effects of hypo- and hyperglycemia revisited.J Neurochem. 1999 Jan;72(1):238-47. doi: 10.1046/j.1471-4159.1999.0720238.x. J Neurochem. 1999. PMID: 9886075
-
Clinical outcomes in youth beyond the first year of type 1 diabetes: Results of the Pediatric Diabetes Consortium (PDC) type 1 diabetes new onset (NeOn) study.Pediatr Diabetes. 2017 Nov;18(7):566-573. doi: 10.1111/pedi.12459. Epub 2016 Oct 19. Pediatr Diabetes. 2017. PMID: 27758023 Free PMC article.
-
A1c, glucose variability and hypoglycemia risk in patients with type 1 diabetes.Minerva Endocrinol. 2014 Jun;39(2):127-33. Minerva Endocrinol. 2014. PMID: 24736487
-
The Evolution of Hemoglobin A1c Targets for Youth With Type 1 Diabetes: Rationale and Supporting Evidence.Diabetes Care. 2021 Feb;44(2):301-312. doi: 10.2337/dc20-1978. Epub 2021 Jan 11. Diabetes Care. 2021. PMID: 33431422 Free PMC article. Review.
-
Biological variation and hemoglobin A1c: relevance to diabetes management and complications.Pediatr Diabetes. 2013 Sep;14(6):391-8. doi: 10.1111/pedi.12055. Pediatr Diabetes. 2013. PMID: 23952704 Review. No abstract available.
Cited by
-
Prolonged systemic hyperglycemia does not cause pericyte loss and permeability at the mouse blood-brain barrier.Sci Rep. 2018 Nov 29;8(1):17462. doi: 10.1038/s41598-018-35576-0. Sci Rep. 2018. PMID: 30498224 Free PMC article.
-
The Relationship between Erythrocytes and Diabetes Mellitus.J Diabetes Res. 2021 Feb 25;2021:6656062. doi: 10.1155/2021/6656062. eCollection 2021. J Diabetes Res. 2021. PMID: 33728350 Free PMC article. Review.
-
Circulating blood cellular glucose transporters - Surrogate biomarkers for neonatal hypoxic-ischemic encephalopathy assessed by novel scoring systems.Mol Genet Metab. 2019 Jun;127(2):166-173. doi: 10.1016/j.ymgme.2019.05.013. Epub 2019 May 29. Mol Genet Metab. 2019. PMID: 31182397 Free PMC article.
-
Impact of Metabolic Syndrome on Neuroinflammation and the Blood-Brain Barrier.Front Neurosci. 2018 Dec 11;12:930. doi: 10.3389/fnins.2018.00930. eCollection 2018. Front Neurosci. 2018. PMID: 30618559 Free PMC article. Review.
-
Red blood cells as glucose carriers to the human brain: Modulation of cerebral activity by erythrocyte exchange transfusion in Glut1 deficiency (G1D).J Cereb Blood Flow Metab. 2023 Mar;43(3):357-368. doi: 10.1177/0271678X221146121. Epub 2022 Dec 15. J Cereb Blood Flow Metab. 2023. PMID: 36523131 Free PMC article.
References
-
- Morgello S, et al. The human blood-brain barrier glucose transporter (GLUT1) is a glucose transporter of gray matter astrocytes. Glia. 1995;14(1):43–54. - PubMed
-
- Devaskar S, et al. The neonatal rabbit brain glucose transporter. Brain Res Dev Brain Res. 1992;67(1):95–103. - PubMed
-
- Mantych GJ, Sotelo-Avila C, Devaskar SU. The blood-brain barrier glucose transporter is conserved in preterm and term newborn infants. J Clin Endocrinol Metab. 1993;77(1):46–9. - PubMed
-
- Zhang JZ, Ismail-Beigi F. Activation of Glut1 glucose transporter in human erythrocytes. Arch Biochem Biophys. 1998;356(1):86–92. - PubMed
-
- Cornford EM, et al. Down-regulation of blood-brain glucose transport in the hyperglycemic nonobese diabetic mouse, in Neurochem Res. 1995. pp. 869–73. - PubMed
Publication types
MeSH terms
Substances
Grants and funding
- M01 RR000865/RR/NCRR NIH HHS/United States
- M01 RR00084/RR/NCRR NIH HHS/United States
- R01 HD029487/HD/NICHD NIH HHS/United States
- UL1 TR000124/TR/NCATS NIH HHS/United States
- HD46979/HD/NICHD NIH HHS/United States
- R01 HD033997/HD/NICHD NIH HHS/United States
- HD41230/HD/NICHD NIH HHS/United States
- HD25024/HD/NICHD NIH HHS/United States
- M01-RR00865/RR/NCRR NIH HHS/United States
- M01 RR000084/RR/NCRR NIH HHS/United States
- UL1 TR000005/TR/NCATS NIH HHS/United States
- UL1TR000124/TR/NCATS NIH HHS/United States
- HD33997/HD/NICHD NIH HHS/United States
- R01 HD041230/HD/NICHD NIH HHS/United States
- R01 HD025024/HD/NICHD NIH HHS/United States
- HD29487/HD/NICHD NIH HHS/United States
- R01 HD046979/HD/NICHD NIH HHS/United States
LinkOut - more resources
Full Text Sources
Other Literature Sources
Medical
Miscellaneous
