

HIF-1-dependent induction of Jumonji domain-containing protein (JMJD) 3 under hypoxic conditions
- PMID: 24552709
- PMCID: PMC3907005
- DOI: 10.14348/molcells.2014.2250
HIF-1-dependent induction of Jumonji domain-containing protein (JMJD) 3 under hypoxic conditions
Abstract
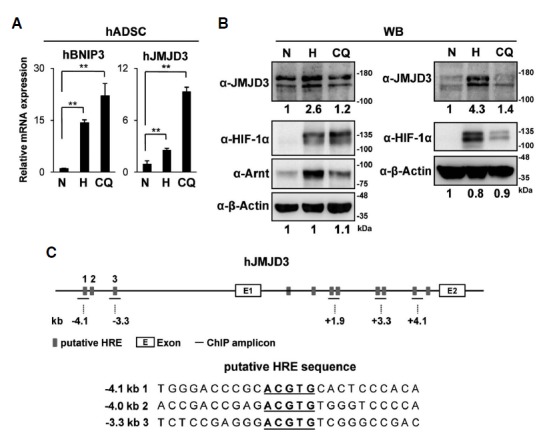
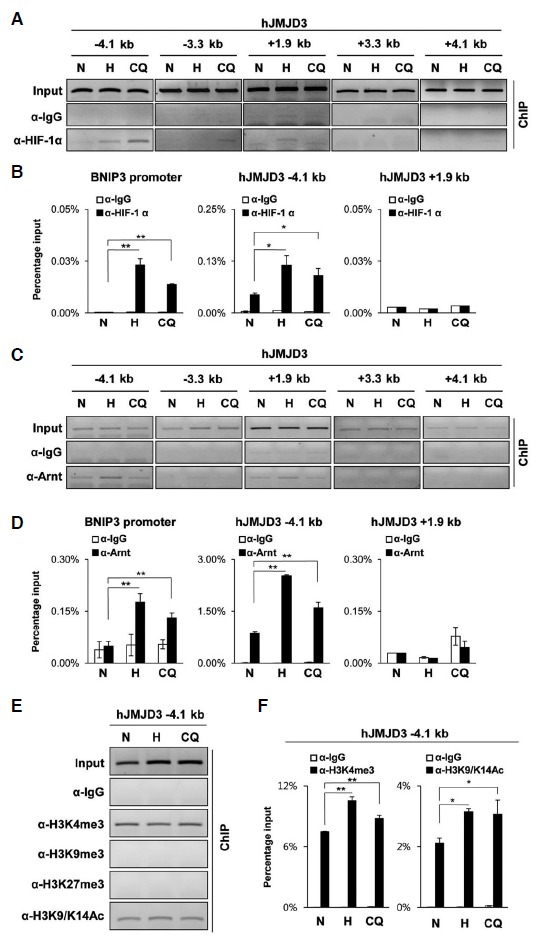
Jumonji domain-containing proteins (JMJD) catalyze the oxidative demethylation of a methylated lysine residue of histones by using O2, α-ketoglutarate, vitamin C, and Fe(II). Several JMJDs are induced by hypoxic stress to compensate their presumed reduction in catalytic activity under hypoxia. In this study, we showed that an H3K27me3 specific histone demethylase, JMJD3 was induced by hypoxia-inducible factor (HIF)-1α/β under hypoxia and that treatment with Clioquinol, a HIF-1α activator, increased JMJD3 expression even under normoxia. Chromatin immunoprecipitation (ChIP) analyses showed that both HIF-1α and its dimerization partner HIF-1β/Arnt occupied the first intron region of the mouse JMJD3 gene, whereas the HIF-1α/β heterodimer bound to the upstream region of the human JMJD3, indicating that human and mouse JMJD3 have hypoxia-responsive regulatory regions in different locations. This study shows that both mouse and human JMJD3 are induced by HIF-1.
Figures


Similar articles
-
Targeting hypoxia-induced HIF-1α/JMJD3/Notch axis in gastric cancer therapy.J Bioenerg Biomembr. 2025 Jun;57(2-3):107-117. doi: 10.1007/s10863-025-10057-y. Epub 2025 Mar 26. J Bioenerg Biomembr. 2025. PMID: 40138042
-
The role of the aryl hydrocarbon receptor nuclear translocator (ARNT) in hypoxic induction of gene expression. Studies in ARNT-deficient cells.J Biol Chem. 1996 Jun 21;271(25):15117-23. doi: 10.1074/jbc.271.25.15117. J Biol Chem. 1996. PMID: 8662957
-
Lysine demethylase KDM6B regulates HIF-1α-mediated systemic and cellular responses to intermittent hypoxia.Physiol Genomics. 2021 Sep 1;53(9):385-394. doi: 10.1152/physiolgenomics.00045.2021. Epub 2021 Jul 23. Physiol Genomics. 2021. PMID: 34297635 Free PMC article.
-
Insights into The Function and Regulation of Jumonji C Lysine Demethylases as Hypoxic Responsive Enzymes.Curr Protein Pept Sci. 2020;21(7):642-654. doi: 10.2174/1389203721666191231104225. Curr Protein Pept Sci. 2020. PMID: 31889485 Review.
-
Regulation of HIF-1alpha at the transcriptional level.Curr Pharm Des. 2009;15(33):3844-52. doi: 10.2174/138161209789649420. Curr Pharm Des. 2009. PMID: 19671046 Review.
Cited by
-
Metabolism and epigenetics in the nervous system: Creating cellular fitness and resistance to neuronal death in neurological conditions via modulation of oxygen-, iron-, and 2-oxoglutarate-dependent dioxygenases.Brain Res. 2015 Dec 2;1628(Pt B):273-287. doi: 10.1016/j.brainres.2015.07.030. Epub 2015 Jul 29. Brain Res. 2015. PMID: 26232572 Free PMC article. Review.
-
JMJD3 in the regulation of human diseases.Protein Cell. 2019 Dec;10(12):864-882. doi: 10.1007/s13238-019-0653-9. Epub 2019 Nov 7. Protein Cell. 2019. PMID: 31701394 Free PMC article. Review.
-
Biochemical and Epigenetic Insights into L-2-Hydroxyglutarate, a Potential Therapeutic Target in Renal Cancer.Clin Cancer Res. 2018 Dec 15;24(24):6433-6446. doi: 10.1158/1078-0432.CCR-18-1727. Epub 2018 Aug 14. Clin Cancer Res. 2018. PMID: 30108105 Free PMC article.
-
Inactivation of SDH and FH cause loss of 5hmC and increased H3K9me3 in paraganglioma/pheochromocytoma and smooth muscle tumors.Oncotarget. 2015 Nov 17;6(36):38777-88. doi: 10.18632/oncotarget.6091. Oncotarget. 2015. PMID: 26472283 Free PMC article.
-
Puerarin 6″-O-xyloside suppressed HCC via regulating proliferation, stemness, and apoptosis with inhibited PI3K/AKT/mTOR.Cancer Med. 2020 Sep;9(17):6399-6410. doi: 10.1002/cam4.3285. Epub 2020 Jul 21. Cancer Med. 2020. Retraction in: Cancer Med. 2024 Oct;13(19):e70301. doi: 10.1002/cam4.70301. PMID: 32691991 Free PMC article. Retracted.
References
-
- Agger K., Cloos P.A., Christensen J., Pasini D., Rose S., Rappsilber J., Issaeva I., Canaani E., Salcini A.E., Helin K. UTX and JMJD3 are histone H3K27 demethylases involved in HOX gene regulation and development. Nature. 2007;449:731–734. - PubMed
-
- Bernstein B.E., Mikkelsen T.S., Xie X., Kamal M., Huebert D.J., Cuff J., Fry B., Meissner A., Wernig M., Plath K., et al. A bivalent chromatin structure marks key developmental genes in embryonic stem cells. Cell. 2006;125:315–326. - PubMed
Publication types
MeSH terms
Substances
LinkOut - more resources
Full Text Sources
Other Literature Sources
