. 2014 Apr;13(4):986-95.
doi: 10.1158/1535-7163.MCT-13-0801. Epub 2014 Feb 19.

Effect of small-molecule modification on single-cell pharmacokinetics of PARP inhibitors

Affiliations

Effect of small-molecule modification on single-cell pharmacokinetics of PARP inhibitors

Greg M Thurber et al. Mol Cancer Ther. 2014 Apr.

Abstract

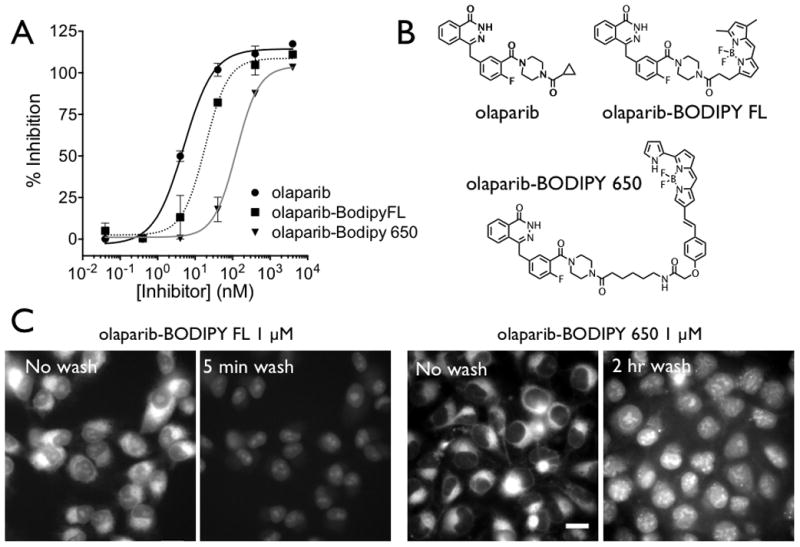
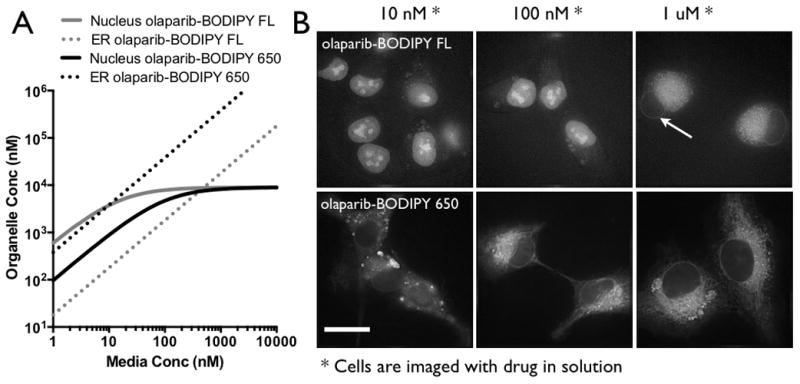
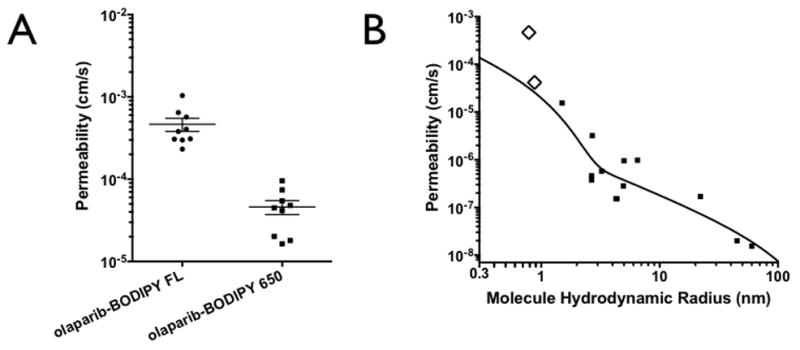
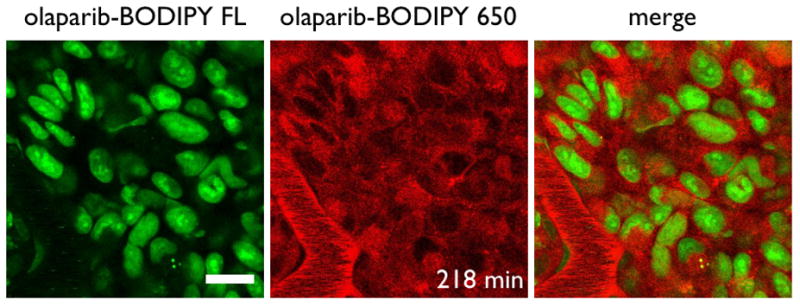
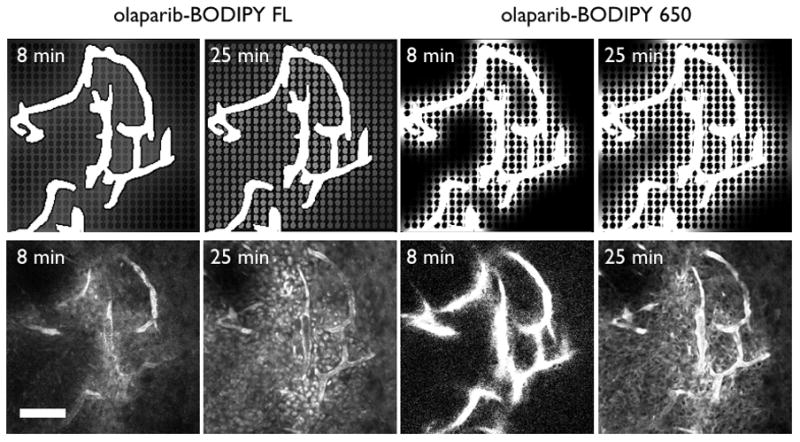
The heterogeneous delivery of drugs in tumors is an established process contributing to variability in treatment outcome. Despite the general acceptance of variable delivery, the study of the underlying causes is challenging, given the complex tumor microenvironment including intra- and intertumor heterogeneity. The difficulty in studying this distribution is even more significant for small-molecule drugs where radiolabeled compounds or mass spectrometry detection lack the spatial and temporal resolution required to quantify the kinetics of drug distribution in vivo. In this work, we take advantage of the synthesis of fluorescent drug conjugates that retain their target binding but are designed with different physiochemical and thus pharmacokinetic properties. Using these probes, we followed the drug distribution in cell culture and tumor xenografts with temporal resolution of seconds and subcellular spatial resolution. These measurements, including in vivo permeability of small-molecule drugs, can be used directly in predictive pharmacokinetic models for the design of therapeutics and companion imaging agents as demonstrated by a finite element model.


Conflict of interest statement

The authors have no conflicts of interest to disclose.

Figures

Figure 1
Figure 1. Molecular Properties and Cellular Imaging
(A) The measured inhibitory concentrations of the three PARP inhibitors with the structure shown in (B). (C) In vitro images of olaparib-BODIPY FL and olaparib-BODIPY 650 show similar patterns of uptake. Before washing, the majority of the probe is located in the perinuclear endoplasmic reticulum, and after washing, the nuclear signal (with higher PARP concentrations in the nucleolus) is more prominent. The kinetics of distribution are significantly different between the two probes, with the olaparib-BODIPY 650 rates around 10 times slower. The ratio of uptake in the ER to the nucleus before washing is also much higher with the olaparib-BODIPY 650 probe. The contrast is identical for olaparib-BODIPY FL before and after the wash, but the contrast was increased after 2 hrs of washing to show the nuclear specific staining which is much lower than the perinuclear signal before washing (Figure S2) Scale bar = 20 μm
Figure 2
Figure 2. Specific Cell Uptake
(A) A simple equilibrium model derived from the kinetic data predicts that the olaparib-BODIPY FL yields a higher nuclear signal at low concentrations and higher ER signal at high concentrations. The greater uptake in the ER for olaparib-BODIPY 650 indicates that at equilibrium, the ER signal will always be higher than the nucleus. (B) Widefield fluorescence images of the cells in equilibrium with probe in the media are consistent with the equilibrium model. Note that the image contrast was changed between the different concentrations due to the order of magnitude difference in signal intensity. Arrow points to lower uptake in nucleus. Scale bar = 20 μm
Figure 3
Figure 3. Tumor Vessel Permeability
(A) Permeability of olaparib-BODIPY FL and olaparib-BODIPY 650 in HT-1080 xenografts. The olaparib-BODIPY FL consistently resulted in an approximately 10-fold higher permeability than olaparib-BODIPY 650. (B) The two olaparib derivatives, shown with open diamonds, compared to a variety of proteins and polymers with varying size (hydrodynamic radius). The black line is a two-pore model fit for paracellular transport(32).
Figure 4
Figure 4. In Vivo Subcellular Distribution
Olaparib-BODIPY FL shows predominantly nuclear and nucleolus uptake after 218 min while olaparib-BODIPY 650 is located primarily in the perinuclear region. Scale bar = 20 μm
Figure 5
Figure 5. Tumoral heterogeneity
Finite element models of the probe distribution (top) during the first half hour show faster distribution for the olaparib-BODIPY FL with nuclear specific staining apparent after only 25 min. The higher non-specific immobilization of olaparib-BODIPY 650 results in more early time heterogeneity. In vivo images for the olaparib-BODIPY FL confirm the lack of nuclear signal at 8 min but presence of the signal by 25 min (bottom). Olaparib-BODIPY 650 has low penetration into the tissue at 8 min, and perinuclear staining readily apparent by 25 min. Scale bar = 100 μm

Similar articles

Cited by

References

    1. Minchinton AI, Tannock IF. Drug penetration in solid tumours. Nature Reviews Cancer. 2006;6:583–92. - PubMed
    1. Thurber GM, Schmidt MM, Wittrup KD. Antibody tumor penetration: Transport opposed by systemic and antigen-mediated clearance. Adv Drug Deliv Rev. 2008;60:1421–34. - PMC - PubMed
    1. Thurber GM, Weissleder R. A Systems Approach for Tumor Pharmacokinetics. PLoS ONE. 2011;6:e24696. - PMC - PubMed
    1. Jain RK. Transport of Molecules, Particles, and Cells in Solid Tumors. Annual Reviews in Biomedical Engineering. 1999;01:241–63. - PubMed
    1. Patel KJ, Tannock IF. The influence of P-glycoprotein expression and its inhibitors on the distribution of doxorubicin in breast tumors. Bmc Cancer. 2009;9 - PMC - PubMed

Publication types

MeSH terms