. 2014;13(6):928-40.
doi: 10.4161/cc.27780. Epub 2014 Jan 16.

Listeria monocytogenes induces host DNA damage and delays the host cell cycle to promote infection

Affiliations

Listeria monocytogenes induces host DNA damage and delays the host cell cycle to promote infection

Elsa Leitão et al. Cell Cycle. 2014.

Abstract

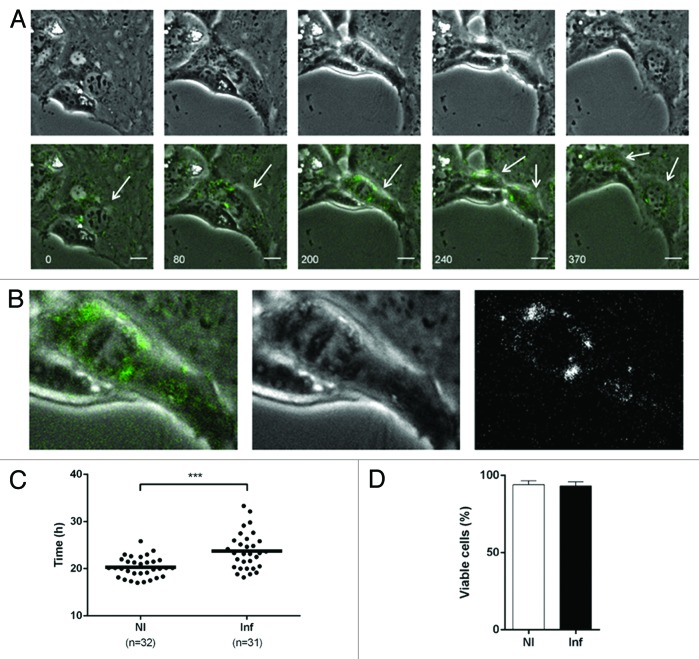
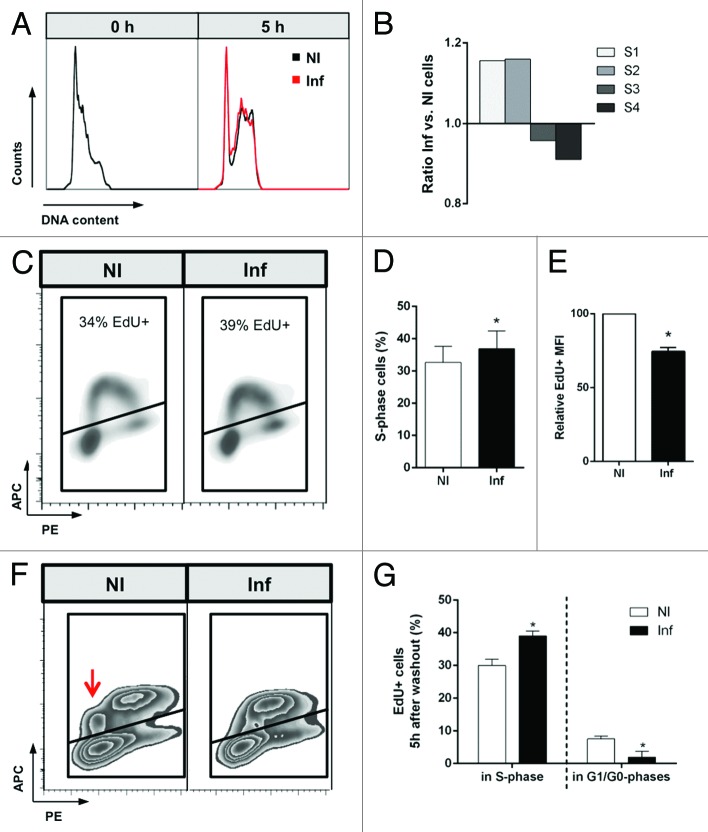
Listeria monocytogenes (Lm) is a human intracellular pathogen widely used to uncover the mechanisms evolved by pathogens to establish infection. However, its capacity to perturb the host cell cycle was never reported. We show that Lm infection affects the host cell cycle progression, increasing its overall duration but allowing consecutive rounds of division. A complete Lm infectious cycle induces a S-phase delay accompanied by a slower rate of DNA synthesis and increased levels of host DNA strand breaks. Additionally, DNA damage/replication checkpoint responses are triggered in an Lm dose-dependent manner through the phosphorylation of DNA-PK, H2A.X, and CDC25A and independently from ATM/ATR. While host DNA damage induced exogenously favors Lm dissemination, the override of checkpoint pathways limits infection. We propose that host DNA replication disturbed by Lm infection culminates in DNA strand breaks, triggering DNA damage/replication responses, and ensuring a cell cycle delay that favors Lm propagation.

Keywords: CDC25A; DNA damage; DNA-PK; Listeria monocytogenes; bacterial infection; host cell cycle.


Figures

None
Figure 1.Lm-infected cells undergo consecutive rounds of division although with increased duration. (A–C) Uninfected (NI) or Lm-infected (Inf, MOI 0.1) Caco-2 cells were followed by live-cell imaging for 72 h. Infection was confirmed by simultaneous acquisition of intracellular GFP signal and phase contrast images. (A) Time-lapse microscopy images from Video S1 showing an infected cell dividing into 2 infected daughter cells. Top panel: phase contrast images; bottom panel: merged phase contrast and GFP signal images. Arrows show the dividing cell and resulting daughter cells. Specific cell cycle stages are depicted: interphase (0 min), nuclear envelope breakdown (80 min), (pro)metaphase (200 min), late anaphase (240 min), daughter cells in interphase (370 min). Partial time is indicated (0 corresponds to 29 h 40 min post-infection). Scale bar = 15 µm. (B) Inset of Figure 1A showing Lm excluded from the mitotic spindle. Merged, phase contrast and GFP signal images are shown. (C) Quantification of the cell cycle duration in NI and Inf cells. The time elapsed between consecutive metaphase plates was determined in time-lapse images. Each dot represents a cell, and the number of cells analyzed is indicated (n). Results are representative of five independent experiments. ***P value < 0.001 (Student t test). (D) Cellular viability was examined 40 h after infection by PI incorporation and flow cytometry analysis. Results are means ± SE from 3 independent experiments.
None
Figure 2.Lm infection induces alterations in the host cell cycle stage distribution. (A and B) Caco-2 or Jeg-3 cells were left uninfected (NI) or infected (Inf, MOI 0.5 and 0.1, respectively) for 17 h. (A) Quantification of DNA histograms from PFA/ethanol-fixed cells (top panels). Inf GFP− corresponds to bystander cells lacking intracellular bacteria and Inf GFP+ to cells with intracellular bacteria. Representative DNA histograms are shown (bottom panels). Results are means ± SEM from at least 3 independent experiments. *Indicates statistical comparisons to NI; #indicates statistical comparisons between Inf GFP− and Inf GFP+ populations; * and #P value < 0.05; ** and ##P value < 0.01; *** and ###P value < 0.001 (one-way ANOVA). (B) Quantification of DNA histograms from ethanol-fixed cells (top panels) and representative histograms (bottom panels). Results are means ± SEM from 5 independent experiments. *Indicate statistical comparisons to NI. *P value < 0.05, **P value < 0.01 (Student t test). (C) Quantification of cell cycle phase distribution of ethanol-fixed Caco-2 cells left NI or infected with increasing doses of Lm (MOI 0.1–1). Results are means ± SEM from 3 independent experiments. *Indicate statistical comparisons to NI. *P value < 0.05; **P value < 0.01 (one-way ANOVA). (D) Quantification of DNA histograms from ethanol-fixed Caco-2 cells left NI or infected for 17 h with Lm (MOI 0.5) or L. innocua-InlA (Li-InlA, MOI 50). Results are means ± SEM from 5 independent experiments. *Indicate statistical comparisons to NI; *P value < 0.05; ***P value < 0.001 (one-way ANOVA). (E) Quantification of DNA histograms from PFA/ethanol-fixed Jeg-3 cells kept NI or infected with LmΔinlA, LmΔinlB, or LmΔinlAB (MOI 0.1, 17 h). Results are means ± SEM from 4 independent experiments. *Indicates statistical comparisons to NI; #indicate statistical comparisons between GFP− and GFP+ populations. * and #P value < 0.05 (one-way ANOVA). (F) Quantification of DNA histograms from ethanol-fixed Caco-2 cells left NI or infected for 17 h with Lm (MOI 0.5) or LmΔhly (MOI 50). Results are means ± SEM from 3 independent experiments. *Indicates statistical comparisons to NI; #indicates statistical comparisons between Lm and LmΔhly. * and #P value < 0.05, **P value < 0.01 (one-way ANOVA).
None
Figure 3.Lm infection induces a delayed S-phase progression in Caco-2 cells. (A and B) Caco-2 cells synchronized at G1/S-phase transition by double thymidine block were released from the cell cycle arrest (0 h), left uninfected (NI), or infected with Lm (Inf, MOI 20), and DNA histograms were generated from ethanol-fixed cells 5 h post-infection. (A) Representative DNA histograms of 2 independent experiments. (B) Analysis of split S-phase statistics (S1, S2, S3, and S4, ranging from lower to higher DNA content) representative of 2 independent experiments. (C–E) NI or Lm-infected (Inf, 18 h) Caco-2 cells were allowed to incorporate EdU during the last 2 h before analysis. (C) Representative flow cytometry density plots showing the discrimination and percentage of S-phase cells (EdU+ population). (D) Quantification of the percentage of S-phase (EdU+) cells. Results are means ± SEM from 3 independent experiments. *P value < 0.05 (Student t test). (E) Quantification of the mean fluorescence intensity (EdU+ MFI). Results are means ± SEM from 3 independent experiments. Values are given relative to NI cells, arbitrarily fixed at 100. *P value < 0.05 (one-sample t test). (F and G) After EdU incorporation, NI or Lm-infected Caco-2 cells were allowed to progress for 5 h, before analysis. (F) Representative flow cytometry contour plots showing the cell cycle progression of EdU-labeled cells 5 h after EdU washout. Red arrow shows EdU+ G1/G0 cells. (G) Quantification of the percentage of EdU+ cells in S and G1/G0 phases, 5 h after EdU pulse. Results are means ± SEM from 3 independent experiments. *P value < 0.05 (Student t test).
None
Figure 4.Lm infection induces DNA strand breaks in host cells. (A, B, and E) Caco-2 cells were left uninfected (NI) or infected with Lm (Inf, MOI 0.5). Etoposide-treated (Etop) and γ-irradiated (IR) cells were used as positive controls. (A) DNA strand breaks measured by single-cell gel electrophoresis (SCGE). Left panels: representative images of comets with respective Comet Assay IV software screenshots for each condition. Right panel: quantification of comet tail intensities. Each dot represents a single comet. The number of comets analyzed per condition is indicated (n). Data are representative of 3 independent experiments. *P value < 0.05, ***P value < 0.001 (one-way ANOVA). (B) DNA integrity assessed by pulse field gel electrophoresis (PFGE). Bands corresponding to intact and fragmented genomic DNA are indicated (left panel), and their relative intensity was quantified (right panel). Data are representative of 3 independent experiments. (C) Caco-2 cells were left NI or infected with Lm (MOI 0.5) or LmΔhly (MOI 10) and the DSB marker γH2A.X was evaluated by immunoblot. Levels of γH2A.X were normalized to total H2A.X and the value for infected cells was expressed relative to the ratio of NI cells, arbitrarily fixed to 100. Graph shows means ± SE from 3 independent experiments. *P value < 0.05 (one-sample t test). (D) Caco-2 cells were left NI or infected with increasing doses of Lm (MOI 0.1–1, 20 h) and the DSB marker γH2A.X was quantified by immunoblot. GAPDH was used as loading control. (E) Assessment of γH2A.X levels by immunofluorescence. Merged images show γH2A.X foci in red and DAPI-stained nuclei in blue (left panel). Scale bar = 20 µm. Graph shows means ± SEM from 4 independent experiments. Approximately 500 nuclei were analyzed per condition. Integrated pixel density of γH2A.X foci was normalized to the total number of nuclei. Infected sample values were expressed relative to the NI sample value arbitrarily fixed to 100. *P value < 0.05 (Student t test).
None
Figure 5. DNA damage checkpoint function is required to favor Lm infection. (A–F) Caco-2 cells were left uninfected (NI) or infected with Lm (Inf, MOI 0.5, 20 h), in the presence or absence of 2 mM caffeine, or subjected to increasing concentrations of etoposide (0–10 μM). γ-irradiated cells (IR) were used as controls. (A) Quantification of DNA histograms from ethanol-fixed cells (top panel). Results are means ± SEM from 4 independent experiments. Representative histograms are shown (bottom panels). *Indicate statistical comparisons to NI, in the presence or absence of caffeine; #indicates statistical comparisons between groups, in presence and absence of caffeine. * and #P value < 0.05; ##P value < 0.01; *** and ###P value < 0.001 (one-way ANOVA). (B) Quantification of the cell cycle duration of NI and Inf cells, in the presence or absence of caffeine. The time elapsed between consecutive metaphase plates was measured in time-lapse images. The number of cells analyzed is indicated (n). Results are representative of 2 independent experiments. *P value < 0.05; ***P value < 0.001 (one-way ANOVA). (C–F) Caffeine and etoposide interfere with Lm infectious potential in opposing manners. (C) Representative flow cytometry density plots showing the percentage of infected cells (GFP+ population) and their mean GFP fluorescence intensity (dotted line), in the presence or absence of caffeine. (D) Quantification of the percentage of infected cells (left panel), mean GFP fluorescence intensity (GFP+ MFI, middle panel) and intracellular bacteria (right panel), in the presence or absence of caffeine. Graphs show means ± SEM from 3 independent experiments. Values are expressed relative to the infection without caffeine, arbitrarily fixed to 100. *P value < 0.05; **P value < 0.01 (one-sample t test). (E) Representative flow cytometry density plots showing the percentage of infected cells (GFP+ population) and their mean GFP fluorescence intensity (dotted line), in the presence or absence of 10 μM etoposide. (F) Graphs show means ± SEM of the percentage of infected cells (left panel) and mean GFP fluorescence intensity (GFP+ MFI, right panel), in the absence or presence of 1 and 10 μM etoposide, from 3 independent experiments. Values are expressed relative to the infection in the absence of etoposide, arbitrarily fixed to 100. **P value < 0.01 (one-sample t test).
None
Figure 6.Lm-induced alterations of the host cell cycle profile are dependent on DNA-PK. (A–C) Expression of ATM, ATR, and DNA-PK was silenced in Caco-2 cells by transfecting simultaneously ATM and ATR (siATM/ATR) or DNA-PK (siDNA-PK) specific siRNAs. Control cells were transfected with non-targeting siRNAs (siCtr). Cells were left uninfected (NI) or infected with Lm (Inf, MOI 0.5, 20 h). (A) Quantification of DNA histograms from ethanol-fixed cells. Results are means ± SEM from at least 3 independent experiments. *Indicates statistical comparisons to NI siCtr; #indicates statistical comparisons between control and targeting siRNAs. * and #P value < 0.05; ##P value < 0.01; ***P value < 0.001 (one-way ANOVA). (B) Quantification of the percentage of infected cells (GFP+) and the mean GFP fluorescence intensity (GFP+ MFI) by flow cytometry. Graphs show means ± SEM from at least 3 independent experiments. Values are given relative to the infection of siCtr cells, arbitrarily fixed at 100. **P value < 0.01 (one-sample t test). (C) Evaluation of ATM, ATR, and DNA-PK expression levels by immunoblot. Top panels show representative immunoblots. Bottom panels show quantifications of GAPDH-normalized ATM, ATR, and DNA-PK expression levels. Expression levels in silenced conditions are given relative to siCtr, arbitrarily fixed to 100. Graph shows means ± SEM from 2 (siATM/ATR) or 3 (siDNA-PK) independent experiments. *P value < 0.05 (one-sample t test).
None
Figure 7. DNA-PK and CDC25A are mediators of the DNA damage/repair signaling cascade elicited by Lm infection, both in vitro and in vivo. (A) Uninfected (NI)/untreated (NT) Caco-2 cells were exposed to increasing MOIs or etoposide doses for 20 h and phosphorylation levels of DNA-PK (p-DNA-PK), H2A.X (γH2A.X), and CDC25A (p-CDC25A) were assessed by immunoblot. GAPDH was used as loading control. Representative immunoblots are shown (top panels). Quantification graphs (bottom panels) show means ± SEM of 3 independent experiments. Values for infected/treated conditions were expressed relative to NI or NT conditions, arbitrarily fixed to 100. *P value < 0.05 (one-sample t test). (B and C) Analysis of γH2A.X and p-CDC25A levels during Lm infection in vivo. BALB/c mice were left uninfected (NI) or infected (Inf) for 1 (B) or 3 d (C) with Lm, and the levels of γH2A.X and p-CDC25A were evaluated by immunoblot on total extracts from mouse spleen cells. Two independent experiments were performed using 2 mice per condition (#1, #2). Immunoblot images (top panels) and quantifications of GAPDH-normalized phosphorylation levels (bottom panels) are shown.

Similar articles

Cited by

References

    1. Swaminathan B, Gerner-Smidt P. The epidemiology of human listeriosis. Microbes Infect. 2007;9:1236–43. doi: 10.1016/j.micinf.2007.05.011. - DOI - PubMed
    1. Camejo A, Carvalho F, Reis O, Leitão E, Sousa S, Cabanes D. The arsenal of virulence factors deployed by Listeria monocytogenes to promote its cell infection cycle. Virulence. 2011;2:379–94. doi: 10.4161/viru.2.5.17703. - DOI - PubMed
    1. Pizarro-Cerda J, Kuhbacher A, Cossart P. Entry of Listeria monocytogenes in mammalian epithelial cells: An updated view. Cold Spring Harb Perspect Med. 2012;2 - PMC - PubMed
    1. Nougayrède JP, Taieb F, De Rycke J, Oswald E. Cyclomodulins: bacterial effectors that modulate the eukaryotic cell cycle. Trends Microbiol. 2005;13:103–10. doi: 10.1016/j.tim.2005.01.002. - DOI - PubMed
    1. Oswald E, Nougayrède JP, Taieb F, Sugai M. Bacterial toxins that modulate host cell-cycle progression. Curr Opin Microbiol. 2005;8:83–91. doi: 10.1016/j.mib.2004.12.011. - DOI - PubMed

Publication types