Review
. 2014 Mar;29(2):80-91.
doi: 10.1097/RTI.0000000000000076.

Cardiopulmonary coupling in chronic obstructive pulmonary disease: the role of imaging

Affiliations
Review

Cardiopulmonary coupling in chronic obstructive pulmonary disease: the role of imaging

Farbod N Rahaghi et al. J Thorac Imaging. 2014 Mar.

Abstract

Chronic obstructive pulmonary disorder (COPD) is a systemic disease that affects the cardiovascular system through multiple pathways. Pulmonary hypertension, ventricular dysfunction, and atherosclerosis are associated with smoking and COPD, causing significant morbidity and poor prognosis. Coupling between the pulmonary and cardiovascular system involves mechanical interdependence and inflammatory pathways that potentially affect the entire circulation. Although treatments specific for COPD-related cardiovascular and pulmonary vascular disease are limited, early diagnosis, study of pathophysiology, and monitoring the effects of treatment are enhanced with improved imaging techniques. In this article, we review recent advancements in the imaging of the vasculature and the heart in patients with COPD. We also explore the potential mechanism of coupling between the progression of COPD and vascular disease. Imaging methods reviewed include specific implementations of computed tomography, magnetic resonance imaging, dual-energy computed tomography, positron emission tomography, and echocardiography. Specific applications to the proximal and distal pulmonary vasculature, as well as to the heart and systemic circulation, are also discussed.


Figures

Figure 1
Figure 1
Pathology of pulmonary hypertension in COPD showing the various progressive processes including smooth muscle proliferation, hyperplasia and deposition of collagen fibers [6] –
Figure 2
Figure 2
Speckle tracking using echocardiography. Speckles are identified on the echocardiogram and their movement is used to assess the relative position of the segments of the ventricular wall [38].
Figure 3
Figure 3
Images of cardiac MRI showing RV anatomical changes in a COPD patient compared to a healthy subject [45].
Figure 4
Figure 4
Computation of PA diameter to aortic diameter ratio in patients with COPD. This ratio has been shown to be predictive of the presence of elevated pulmonary arterial pressures and correlated with frequency of exacerbations [53].
Figure 5
Figure 5
Quantification of pulmonary vascular blood volume from volumetric CT scans and comparison of a non-smoker and a smoker with advanced COPD showing loss of pulmonary vasculature and decreased blood volume in the smaller vessels[62].
Figure 6
Figure 6
Classic angiogram showing distal vessel pruning in various stages of pulmonary hypertension associated with congenital heart defects [63].
Figure 7
Figure 7
Angiogram constructed using MRI showing the pulmonary arterial anatomy[65].
Figure 8
Figure 8
Dual energy CT used to detect areas of perfusion defect, in this case caused by a pulmonary embolus. A) Axial reconstruction with color-coded dual energy perfusion, showing perfusion defects in both lungs. B) Coronal reconstruction with perfusion defects throughtout except the apices. C) Volume rendered image. (From Siemen’s booklet on their dual CT device)
Figure 9
Figure 9
Pulmonary perfusion as assessed by contrast dilution techniques. Panel a shows the reference chest CT with panlobular emphysema. Panel b shows heterogeneously decreased regional pulmonary blood flow. Panel c shows heterogeneously decreased blood volume. Panel d shows decreased regional mean transit time of blood [73].
Figure 10
Figure 10
PET imaging used to quantify the heterogeneity of regional ventilation and regional perfusion in lungs of a normal patient and a patient with COPD. Larger spatial filter length scales are used to highlight heterogeneity on different scales. Using this method it was demonstrated that the heterogeneity in perfusion was greater in patients with COPD and that it is not wholly accounted for by the heterogeneity in regional ventilation[79].

Similar articles

Cited by

References

    1. Divo M, et al. Comorbidities and risk of mortality in patients with chronic obstructive pulmonary disease. Am J Respir Crit Care Med. 2012;186(2):155–61. - PubMed
    1. Minai OA, Chaouat A, Adnot S. Pulmonary hypertension in COPD: epidemiology, significance, and management: pulmonary vascular disease: the global perspective. Chest. 2010;137(6 Suppl):39S–51S. - PubMed
    1. Barr RG, et al. Subclinical atherosclerosis, airflow obstruction and emphysema: the MESA Lung Study. Eur Respir J. 2012;39(4):846–54. - PMC - PubMed
    1. Budoff MJ, et al. Coronary artery and thoracic calcium on noncontrast thoracic CT scans: comparison of ungated and gated examinations in patients from the COPD Gene cohort. J Cardiovasc Comput Tomogr. 2011;5(2):113–8. - PMC - PubMed
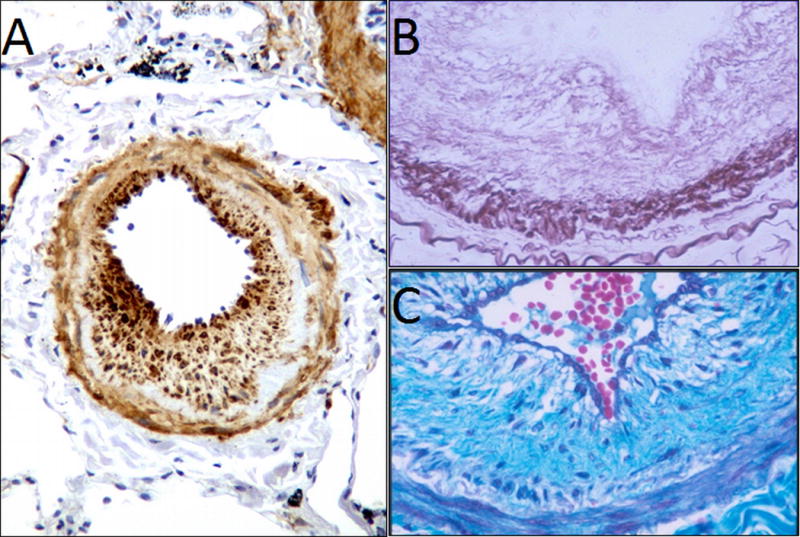
    1. Santos S, et al. Characterization of pulmonary vascular remodelling in smokers and patients with mild COPD. Eur Respir J. 2002;19(4):632–8. - PubMed

MeSH terms