. 2014 Feb 27;506(7489):451-5.
doi: 10.1038/nature13109. Epub 2014 Feb 19.

C11orf95-RELA fusions drive oncogenic NF-κB signalling in ependymoma

Affiliations

C11orf95-RELA fusions drive oncogenic NF-κB signalling in ependymoma

Matthew Parker et al. Nature. .

Erratum in

  • Nature. 2014 Apr 24;508(7497):554. Becksford, Jared [corrected to Becksfort, Jared]

Abstract

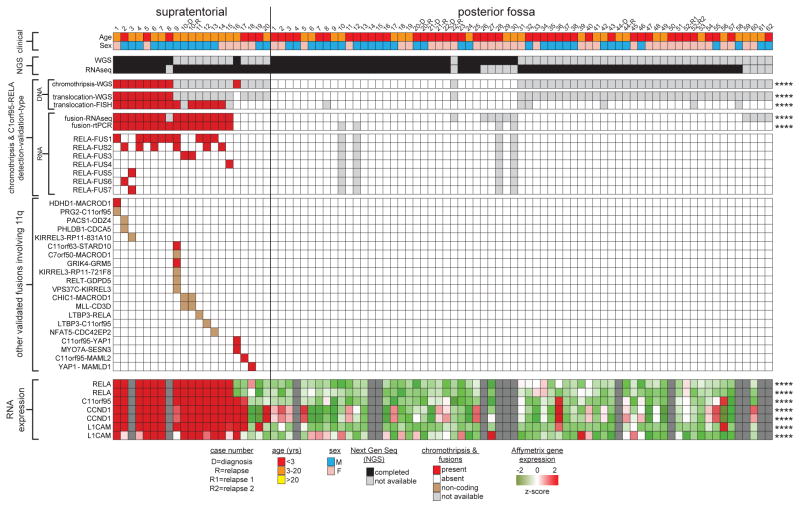
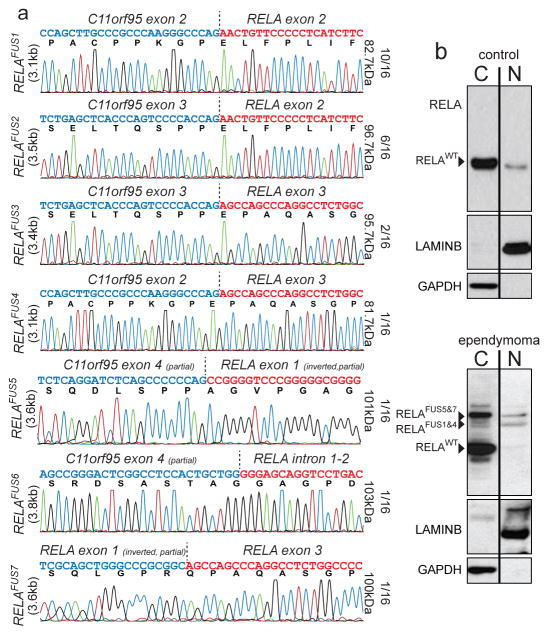
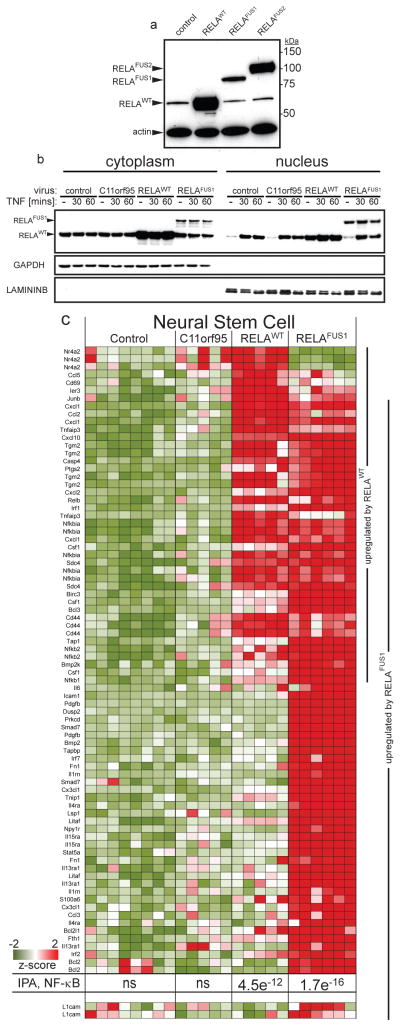
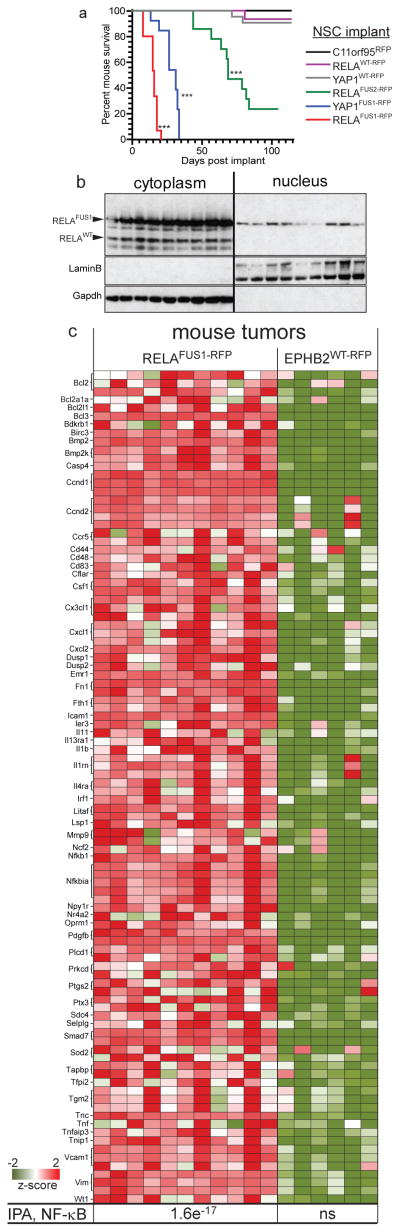
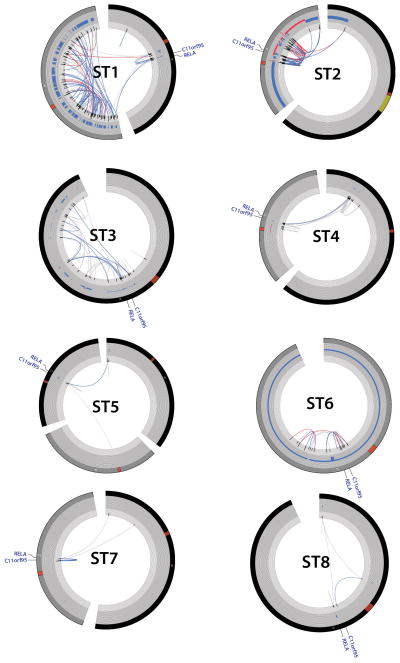
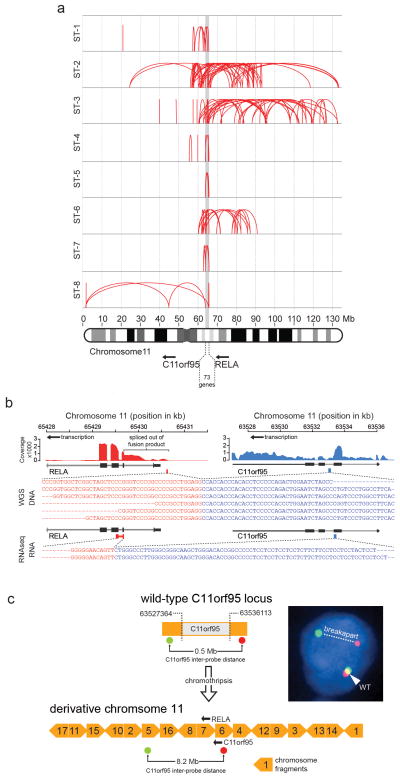
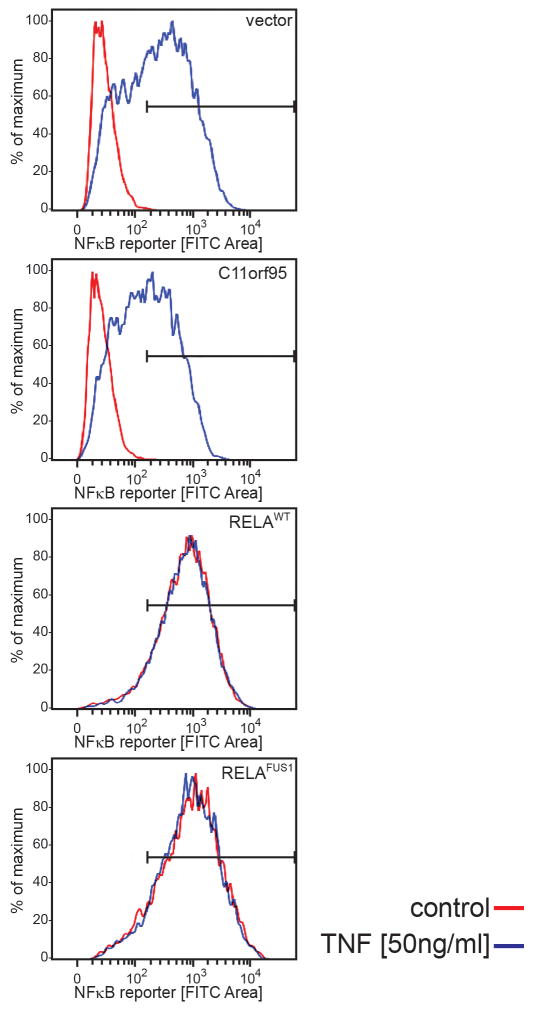
Members of the nuclear factor-κB (NF-κB) family of transcriptional regulators are central mediators of the cellular inflammatory response. Although constitutive NF-κB signalling is present in most human tumours, mutations in pathway members are rare, complicating efforts to understand and block aberrant NF-κB activity in cancer. Here we show that more than two-thirds of supratentorial ependymomas contain oncogenic fusions between RELA, the principal effector of canonical NF-κB signalling, and an uncharacterized gene, C11orf95. In each case, C11orf95-RELA fusions resulted from chromothripsis involving chromosome 11q13.1. C11orf95-RELA fusion proteins translocated spontaneously to the nucleus to activate NF-κB target genes, and rapidly transformed neural stem cells--the cell of origin of ependymoma--to form these tumours in mice. Our data identify a highly recurrent genetic alteration of RELA in human cancer, and the C11orf95-RELA fusion protein as a potential therapeutic target in supratentorial ependymoma.


Conflict of interest statement

Competing interests.

None.

Figures

Figure 1
Figure 1. Recurrent C11orf95-RELA translocations in human supratentorial ependymoma
Summary of results of molecular assays of translocations in tumours from 82 patients with ependymoma (****=P<0.0001 Fisher’s Exact Test for supratentorial vs. posterior fossa tumour). ‘RNA expression’ at bottom reports Affymetrix array data (****=Q<0.0001 for supratentorial vs. posterior fossa tumour).
Figure 2
Figure 2. C11orf95-RELA fusion transcripts and proteins
(a) Electropherograms of seven distinct RELA fusion transcripts detected in ependymoma. The proportion of tumours containing the corresponding fusion transcript, and the predicted protein product size are shown right. (b) Western blotting of RELA proteins in cytoplasmic and nuclear extracts of ‘control’ human 293T cells (top) and supratentorial ependymoma ST3 (bottom).
Figure 3
Figure 3. Cell trafficking and transcriptional activity of wild-type and fusion RELA proteins
(a) RELA western blotting of 293T cells transduced with the indicated retroviruses. (b) Western blotting of RELA proteins in cytoplasmic and nuclear extracts of 293T cells transduced with the indicated virus, treated with TNF [50ng/ml]. (c) Expression of NF-κB target genes upregulated in mouse NSCs transduced by the indicated retrovirus. P-value of NF-κB pathway activation detected by IPA and expression of L1cam are shown bottom (see Supplementary Methods for source of target genes).
Figure 4
Figure 4. C11orf95-RELA and C11orf95-YAP1 fusions drive brain tumourigenesis
(a) Survival curves of mice implanted with the indicated NSCs. (***=p<0.0001, Log Rank relative to control NSCs). (b) Western blotting of RELA proteins in cytoplasmic and nuclear extracts of nine independent mouse RELAFUS1-RFP brain tumours. (c) Expression of NF-κB target genes significantly upregulated in RELAFUS1-RFP relative to EPHB2WT-RFP brain tumours. Bottom, p-value of NF-κB activation detected by IPA.
Extended Data Figure 1
Extended Data Figure 1. Next Generation Sequencing Coverage of Ependymoma Samples
(a) Coverage for whole-genome sequenced cases. Percent of the genome (left) and exome (right) covered at 10x, 20x, and 30x depth in tumour and germline samples. (b) RNASeq coverage. Coverage below the red line are considered poor quality; those with 20x above the green line are considered excellent.
Extended Data Figure 2
Extended Data Figure 2. Comparison of genomic aberrations among ependymomas analysed by Whole Genome Sequencing
(a) The great majority of ependymomas have <10 coding SNV. Samples with >20 coding SNVs and their corresponding sample number from Fig. 1 are shown. (b) Comparison of total number of SVs in PF and ST samples (Wilcox rank sum, p=0.0006). (c) CIRCOS plot depicting SVs discovered across all supratentorial (red, outer plot) and posterior fossa (blue, inner plot) ependymomas. Each dot represents a validated or putative SV breakpoint detected by CREST in the WGS discovery cohort. Note the highly focal clustering of SVs on Chr11q in supratentorial ependymomas.
Extended Data Figure 3
Extended Data Figure 3. Chromothripsis in supratentorial ependymomas resulting in C11orf95-RELA translocations
CIRCOS plots for supratentorial the eight ST ependymomas analysed using WGS that contained C11orf95-RELA translocations (sample numbers as Fig 1). From the outer ring to the inner ring; chromosome, CNV calls, Softclip count histogram, SVs (red = both sides with >= 10, blue = one side with >10, grey < 10 supporting softclips on either side).
Extended Data Figure 4
Extended Data Figure 4. C11orf95-RELA translocations
(a) Breakpoints of structural rearrangements (red loops) at 11q13.1 in tumours ST1 to ST8. (b) Exemplary C11orf95-RELA translocation and fusion transcript in sample ST5. Top, RNAseq coverage; middle, DNA sequence across the fusion breakpoint; bottom, RNA sequence. (c) Derivative chromosome generated by chromothripsis in tumor ST6 highlighting the locations of C11orf95 ‘break-apart’ FISH probes. Yellow block arrows represent chromosome fragments rearranged by chromothripsis. Numbers indicate fragment order on normal chromosome 11. FISH result, right. Arrows=transcription orientation.
Extended Data Figure 5
Extended Data Figure 5. Translocation fusions transcripts and predicted protein products detected in ependymoma
(a) Reverse-transcriptast PCR products of the indicated transcripts detected in tumour samples (sample numbers as in Fig 1a). (b) Predicted protein products of wild-type translocation partners (top) and fusion products (bottom).
Extended Data Figure 6
RNAseq contig maps demonstrating the various fusion products generated by splicing of the primary C110rf95-RELA translocation transcript.
Extended Data Figure 7
Extended Data Figure 7. Analysis of C11orf95-RELA translocation and expression in formalin fixed paraffin embedded (FFPE) human and mouse ependymoma
(a) FFPE cohort (top) and results (middle) of break-apart FISH (bFISH) and rtPCR analysis of the C11orf95-RELA translocation and transcript, respectively. Tumors with ‘unavailable’ data had insufficient material for analysis. (b) GFAP, p-S276-RELA, CCND1 and L1CAM immunohistochemistry in human and mouse RELAFUS positive and negative cases. The mouse tumours recapitulate the ‘vascular-variant’ of human supratentorial ependymoma (see H&E). This subtype is characterized a branching network of capillaries (white arrows) and cytoplasmic clearing (black arrows). ***=p<0.0005. Scale bar=50μm
Extended Data Figure 8
Extended Data Figure 8. C11orf95-RELA fusion protein spontaneously activates an NF-kB transcriptional reporter
NF-kB-green fluorescence reporter (GFP) activity in 293T cells transduced with the indicated virus, treated for 60 mins with TNF [50ng/ml] or vehicle control.

Comment in

References

    1. Kleihues P, et al. The WHO classification of tumors of the nervous system. J Neuropathol Exp Neurol. 2002;61:215–225. discussion 226–219. - PubMed
    1. Merchant TE, et al. Conformal radiotherapy after surgery for paediatric ependymoma: a prospective study. Lancet Oncol. 2009;10:258–266. - PMC - PubMed
    1. Modena P, et al. Identification of tumor-specific molecular signatures in intracranial ependymoma and association with clinical characteristics. J Clin Oncol. 2006;24:5223–5233. - PubMed
    1. Taylor MD, et al. Radial glia cells are candidate stem cells of ependymoma. Cancer Cell. 2005;8:323–335. - PubMed
    1. Puget S, et al. Candidate genes on chromosome 9q33–34 involved in the progression of childhood ependymomas. J Clin Oncol. 2009;27:1884–1892. - PubMed

Publication types

MeSH terms