Update: influenza activity - United States, September 29, 2013-February 8, 2014

Carmen S Arriola et al. MMWR Morb Mortal Wkly Rep. .

Abstract

Influenza activity in the United States began to increase in mid-November and remained elevated through February 8, 2014. During that time, influenza A (H1N1)pdm09 (pH1N1) viruses predominated overall, while few B and A (H3N2) viruses were detected. This report summarizes U.S. influenza activity* during September 29, 2013-February 8, 2014, and updates the previous summary.


Figures
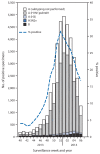
FIGURE 1
FIGURE 1
Number* and percentage of respiratory specimens testing positive for influenza, by type, surveillance week, and year — U.S. World Health Organization and National Respiratory and Enteric Virus Surveillance System collaborating laboratories, United States, 2013–14 influenza season * N = 36,619. Data reported as of February 14, 2014.
FIGURE 2
FIGURE 2
Percentage of all outpatient visits that are for influenza-like illness (ILI)* reported to CDC, by surveillance week — Outpatient Influenza-Like Illness Surveillance Network, United States, September 29, 2013–February 8, 2014, and selected previous influenza seasons * Defined as a fever (≥100°F [≥37.8°C]), oral or equivalent, and cough and/or sore throat, without a known cause other than influenza. Data reported as of February 14, 2014. § The national baseline is the mean percentage of visits for ILI during weeks with little or no influenza virus circulation (noninfluenza weeks) for the previous three seasons plus two standard deviations. A noninfluenza week is defined as periods of ≥2 consecutive weeks in which each week accounted for <2% of the season’s total number of specimens that tested positive for influenza. National and regional percentages of patient visits for ILI are weighted on the basis of state population. Use of the national baseline for regional data is not appropriate.
FIGURE 3
FIGURE 3
Rates of hospitalization for laboratory-confirmed influenza, by age group and surveillance week — FluSurv-NET,* 2013–14 * FluSurv-NET conducts population-based surveillance for laboratory-confirmed influenza-associated hospitalizations in children aged <18 years (since the 2003–04 influenza season) and adults aged ≥18 years (since the 2005–06 influenza season). The FluSurv-NET covers approximately 80 counties in the 10 Emerging Infections Program states (California, Colorado, Connecticut, Georgia, Maryland, Minnesota, New Mexico, New York, Oregon, and Tennessee) and additional Influenza Hospitalization Surveillance Project states (Michigan, Ohio, and Utah). Data reported as of February 14, 2014.
FIGURE 4
FIGURE 4
Percentage of laboratory-confirmed influenza hospitalizations and influenza-associated deaths, by age group* and influenza seasons — FluSurv-NET and 122 U.S. Cities Mortality Reporting System, United States, 2010–14 influenza seasons * For laboratory-confirmed influenza hospitalizations, age groups are 0–17 years, 18–64 years, and ≥65 years; for influenza-associated deaths, age groups are 0–24 years, 25–64 years, and ≥65 years. Influenza A (H3N2) was the predominant virus circulating during the three previous seasons, while influenza A (H1N1)pdm09 has been the predominant virus circulating during the 2013–14 influenza season. For the 2013–14 season, all values presented are early estimates or data through week 6 of the influenza season; for previous seasons, data shown are end-of-season values. § Totals were 6,307 for the 2010–11 season, 2,409 for the 2011–12 season, 12,371 for the 2012–13 season, and 6,655 through February 8, 2014, for the 2013–14 season. Totals were 406 for the 2010–11 season, 122 for the 2011–12 season, 753 for the 2012–13 season, and 571 through February 8, 2014, for the 2013–14 season.

References

    1. CDC. Update: influenza activity—United States, September 29–December 7, 2013. MMWR. 2013;62:1032–36. - PMC - PubMed
    1. Jhung MA, Swerdlow D, Olsen SJ, et al. Epidemiology of 2009 pandemic influenza A (H1N1) in the United States. Clin Infect Dis. 2011;52(Suppl 1):S13–26. - PubMed
    1. CDC. FluView: influenza-associated hospitalizations. Atlanta, GA: US Department of Health and Human Services, CDC; 2014. Available at http://www.cdc.gov/flu/weekly.
    1. Hancock K, Veguilla V, Xiuhua L, et al. Cross-reactive antibody responses to the 2009 pandemic H1N1 influenza virus. N Engl J Med. 2009;361:1945–52. - PubMed
    1. CDC. FluVaxView. Atlanta, GA: US Department of Health and Human Services, CDC; 2014. Available at http://www.cdc.gov/flu/fluvaxview.

MeSH terms