. 2014 Feb 20:4:4146.
doi: 10.1038/srep04146.

Unique macrophages different from M1/M2 macrophages inhibit T cell mitogenesis while upregulating Th17 polarization

Affiliations

Unique macrophages different from M1/M2 macrophages inhibit T cell mitogenesis while upregulating Th17 polarization

Yutaka Tatano et al. Sci Rep. .

Abstract

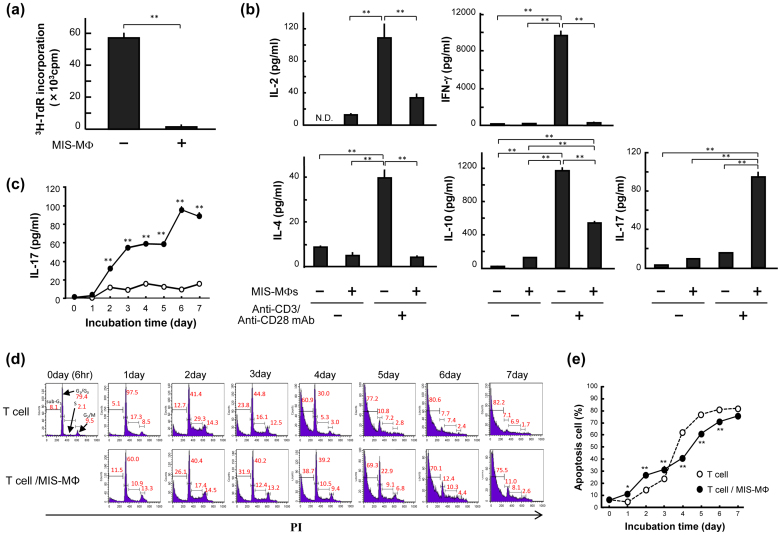
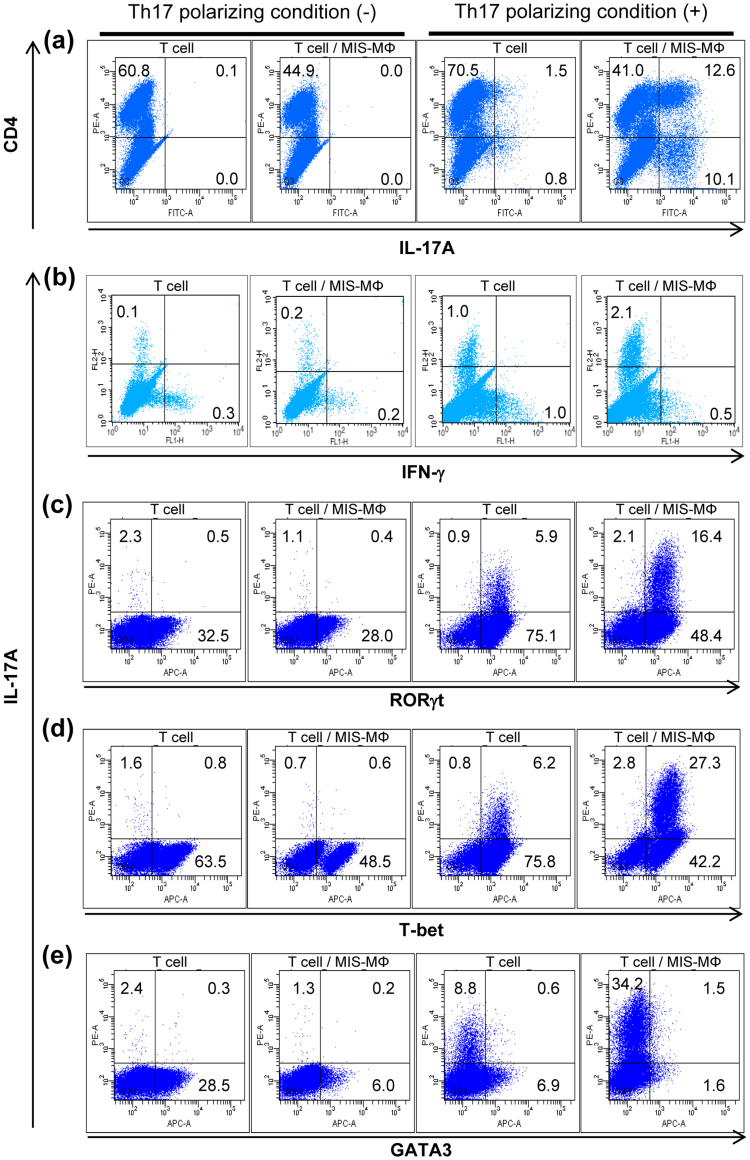
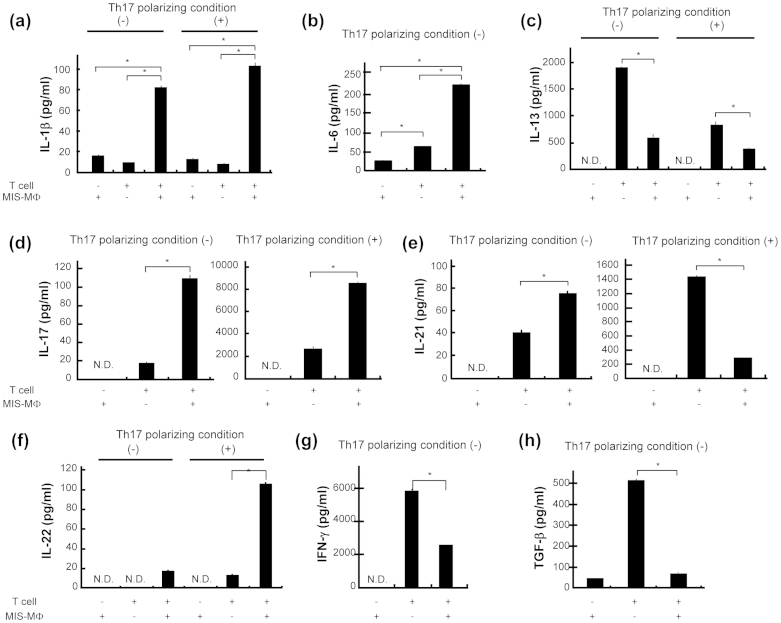
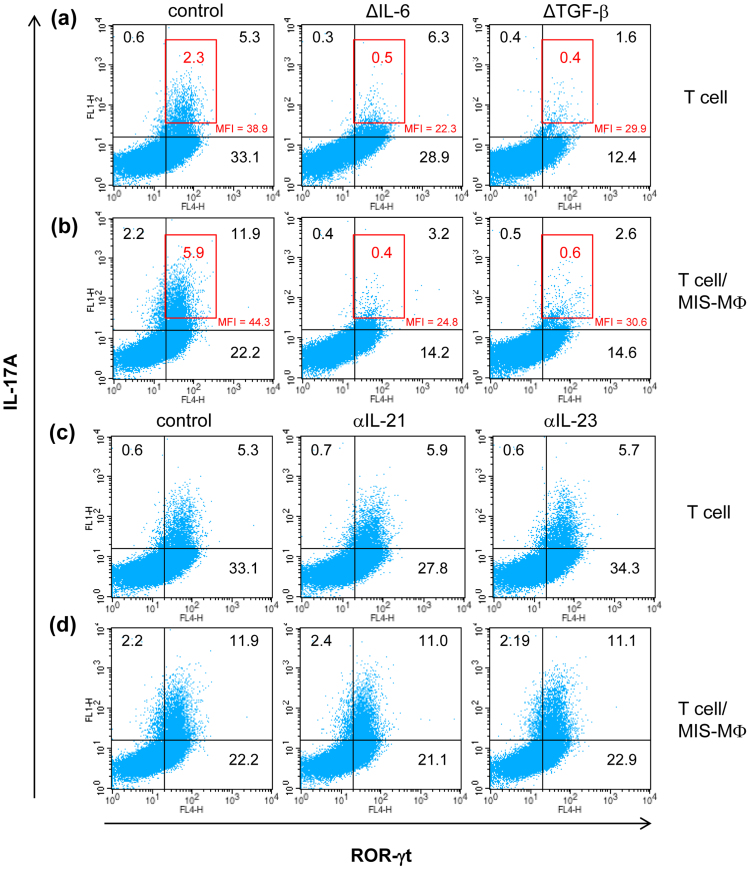
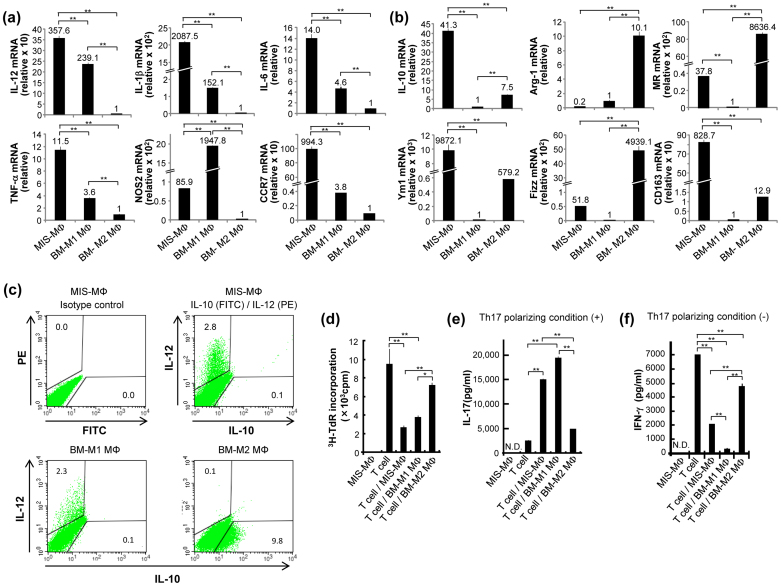
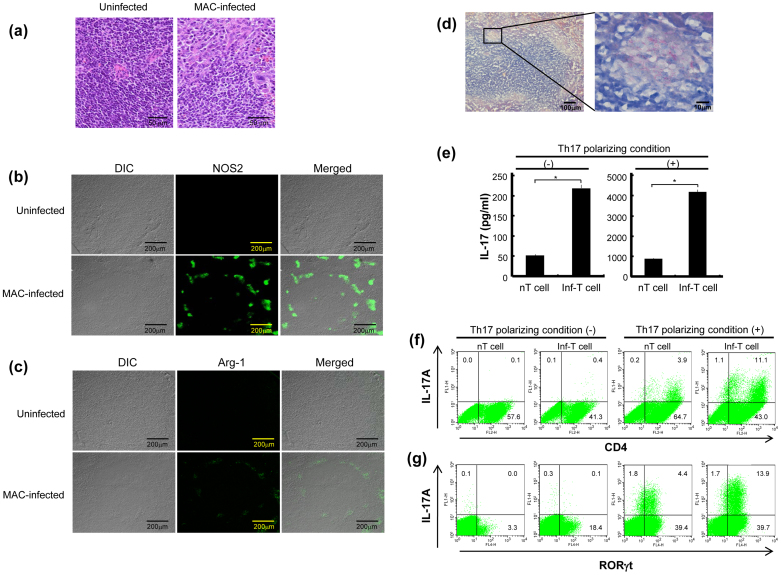
Mycobacterial infection induces suppressor macrophages (MΦs), causing disease exacerbation. There are two major MΦ subsets (M1 and M2 MΦs) that are phenotypically and functionally different. Here, we examined which of the MΦ subsets the mycobacterial infection-induced suppressor MΦs (MIS-MΦs) belong to. MIS-MΦs down-regulated T cell production of Th1 and Th2 cytokines but markedly increased production of interleukin (IL)-17A and IL-22 through up-regulation of Th17 cell expansion. In this phenomenon, a novel MΦ population, which is functionally distinguishable from M1 and M2 MΦ subsets and possesses unique phenotypes (IL-12(+), IL-1β(high), IL-6(+), tumor necrosis factor (TNF)-α(+), nitric oxide synthase (NOS) 2(+), CCR7(high), IL-10(high), arginase (Arg)-1(-), mannose receptor (MR)(low), Ym1(high), Fizz(low), and CD163(high)), played central roles through the action of IL-6 and transforming growth factor (TGF)-β but not IL-21 and IL-23. This new type of MΦ population was induced in infected mice and actively supported the in vivo expansion of Th17 cells.


Figures

Figure 1
Figure 1. Effects of the MIS-MΦs on T cell production of various cytokines.
(a), (b) Anti-CD3 Ab/Anti-CD28 Ab-stimulated T cells (TCR-stimulated T cells) were cultivated with or without a monolayer culture of MIS-MΦs for 72 hr and measured for proliferative response (a) and production of cytokines in culture fluids by ELISA (b). (c) TCR-stimulated T cells were cultured with or without a monolayer culture of MIS-MΦs for up to 7 days. At intervals, concentrations of IL-17 in culture fluids were measured. (d), (e) Cultured T cells harvested at the same time points were stained with PI (10 μg/ml) after RNase A (200 μg/ml) treatment, subjected to cytofluorometry (d). The ratio of apoptotic T cells was estimated based on the ratio of the sub-G1 cell population (e). Data are representative of multiple experiments; error bars, s.e.m.; **p < 0.01, *p < 0.05 (Bonferroni's multiple t-test).
Figure 2
Figure 2. Effects of MIS-MΦs on intracellular expression of IL-17A (a), IFN-γ (b), and some transcription factors, including Th17-specific RORγt (c), Th1-specific T-bet (d) and Th2-specific GATA3 (e).
TCR-stimulated T cells were cultured with or without a monolayer culture of MIS-MΦs under the Th17 polarizing condition in RPMI medium containing IL-6 (20 ng/ml), TGF-β (1 ng/ml), anti-IFN-γ Ab (1 μg/ml), and anti-IL-4 Ab (1 μg/ml) (designated Th17 polarizing medium), indicated as “Th17 polarizing condition (+)”, or in the non-Th17 skewing condition in RPMI medium without these supplements, indicated as “Th17 polarizing condition (-)”. After 5-day cultivation, T cells were treated with PMA (25 ng/ml), A23187 (125 ng/ml), and Golgistop (0.33 μl/well) for 6 hr, and subjected to blocking with anti-CD16 Ab/anti-CD32 Ab (1 μg/ml each) and then paraformaldehyde fixation. After rinsing with 1% FBS-PBS, the resultant cells were treated with BD Perm for 15 min, stained with test Abs according to BD's instructions for 30 min, and subjected to cytofluorometry. Data are representative of multiple experiments.
Figure 3
Figure 3. Production of various cytokines by T cells with or without co-cultivation with MIS-MΦs.
TCR-stimulated T cells were cultured with or without a monolayer culture of MIS-MΦs under either the Th17 polarizing condition or non-Th17 skewing condition. Culture fluids were harvested after 5-day cultivation and measured for the concentrations of test cytokines, including IL-1β (a), IL-6 (b), IL-13 (c), IL-17 (d), IL-21 (e), IL-22 (f), IFN-γ (g), and TGF-β (h) by ELISA. Data are representative of multiple experiments; error bars, s.e.m.; *p < 0.01 (Bonferroni's multiple t-test).
Figure 4
Figure 4. Determination of factors playing roles in the enhancement of Th17 polarization mediated by MIS-MΦs.
TCR-stimulated T cells were cultured in the absence (a), (c) or presence (b), (d) of monolayer culture of MIS-MΦs under the Th17 polarizing condition. In some experiments, IL-6 or TGF-β was deleted from the Th17 polarizing medium (a), (b), or anti-IL-21 Ab or anti-IL-23 Ab was added to the Th17 polarizing medium (c), (d). After 5-day cultivation, cultured T cells were harvested and subjected to the measurement of intracellular expression of IL-17A and RORγt as described in Fig. 2. The distribution profiles of cells strongly expressing IL-17A are indicated in the inserted red squares. MFI: mean fluorescence intensity of IL-17A expression by cells distributed in the upper right corner. Data are representative of multiple experiments.
Figure 5
Figure 5. Profiles of mRNA expression of M1 MΦ- and M2 MΦ-specific marker genes by MIS-MΦs.
(a), (b) Total RNAs extracted using ISOGEN kit (Nippon Gene) from MIS-MΦs, BMDM-derived M1-type MΦs (BM-M1 MΦs), and M2-type MΦs (BM-M2 MΦs) were subjected to real-time quantitative RT-PCR for M1 MΦ-marker genes (IL-12, IL-1β, IL-6, TNF-α, NOS2, and CCR7) (a) or M2 MΦ-marker genes (IL-10, Arg-1, MR, Ym1, Fizz, and CD163 (b) as described in Experimental Procedures. (c) MIS-MΦs, BM-M1 MΦs, and BM-M2 MΦs were measured for intercellular expression of IL-12 and IL-10 by cytofluorometry, as described in Fig. 2. Control: MIS-MΦs were stained with FITC-labeled, and PE-labeled rat IgG2b isotype control antibodies. (d–f) Test MΦs were measured for their suppressor activity against T cell mitogenesis (d) and effects on T cell production of IL-17 (e) and IFN-γ (f) as described in Fig. 3. Data are representative of multiple experiments; error bars, s.e.m.; **p < 0.01, *p < 0.05 (Bonferroni's multiple t-test).
Figure 6
Figure 6. In vivo expansion of M1 MΦs, M2 MΦs, and Th17 cells in the spleens of host mice with mycobacterial infection.
(a–c) Histopathologic features of the spleen of MAC-infected host mice. (a) The thin sections of spleens from uninfected and infected mice (2 weeks after infection) were subjected to HE staining. (b), (c) The thin sections were stained with either rabbit anti-NOS2 Ab (b) or anti-Arg-1 Ab (c), followed by staining with Fluor 488-conjugated secondary Ab, and subjected to confocal microscopy as described in Experimental Procedures. (d) The thin sections of spleen of infected mice were stained for acid-fast bacilli by the Ziehl-Neelsen staining method. (e–g) Splenic T cells from MAC-infected mice (2 weeks after infection; Inf-T cells) and uninfected mice (nT cells) were stimulated with anti-CD3 and anti-CD28 Abs and cultured under either the Th17 polarizing condition or non-Th17 skewing condition. After 5-day cultivation, culture fluids and cultured T cells were harvested and subjected to measurement of IL-17 concentrations (e) and intracellular expressions of IL-17A (f) and RORγt (g), as described in Fig. 3 and Fig. 2, respectively. Data are representative of multiple experiments; error bars, s.e.m.; *p < 0.01 (Bonferroni's multiple t-test).

Similar articles

Cited by

References

    1. Benoit M., Desnues B. & Mege J. L. Macrophage polarization in bacterial infections. J. Immunol. 181, 3733–3739 (2008). - PubMed
    1. Lugo-Villarino G., Verollet C., Maridonneau-Parini I. & Neyrolles O. Macrophage polarization: convergence point targeted by Mycobacterium tuberculosis and HIV. Front. Immunol. 2, 43 (2011). - PMC - PubMed
    1. Murray P. J. & Wynn T. A. Protective and pathogenic functions of macrophage subsets. Nat. Rev. Immunol. 11, 723–737 (2011). - PMC - PubMed
    1. Sica A. & Mantovani A. Macrophage plasticity and polarization: in vivo veritas. J. Clin. Invest. 122, 787–795 (2012). - PMC - PubMed
    1. Tomioka H. et al. Characteristics of suppressor macrophages induced by mycobacterial and protozoal infections in relation to alternatively activated M2 macrophages. Clin. Dev. Immunol. 2012, 635451 (2012). - PMC - PubMed

Publication types

MeSH terms