. 2014 Feb 19;34(8):2845-59.
doi: 10.1523/JNEUROSCI.1782-13.2014.

Differential entrainment and learning-related dynamics of spike and local field potential activity in the sensorimotor and associative striatum

Affiliations

Differential entrainment and learning-related dynamics of spike and local field potential activity in the sensorimotor and associative striatum

Catherine A Thorn et al. J Neurosci. .

Abstract

Parallel cortico-basal ganglia loops are thought to have distinct but interacting functions in motor learning and habit formation. In rats, the striatal projection neuron populations (MSNs) in the dorsolateral and dorsomedial striatum, respectively corresponding to sensorimotor and associative regions of the striatum, exhibit contrasting dynamics as rats acquire T-maze tasks (Thorn et al., 2010). Here, we asked whether these patterns could be related to the activity of local interneuron populations in the striatum and to the local field potential activity recorded simultaneously in the corresponding regions. We found that dorsolateral and dorsomedial striatal fast-spiking interneurons exhibited task-specific and training-related dynamics consistent with those of corresponding MSN populations. Moreover, both MSNs and interneuron populations in both regions became entrained to theta-band (5-12 Hz) frequencies during task acquisition. However, the predominant entrainment frequencies were different for the sensorimotor and associative zones. Dorsolateral striatal neurons became entrained mid-task to oscillations centered ∼ 5 Hz, whereas simultaneously recorded neurons in the dorsomedial region became entrained to higher frequency (∼ 10 Hz) rhythms. These region-specific patterns of entrainment evolved dynamically with the development of region-specific patterns of interneuron and MSN activity, indicating that, with learning, these two striatal regions can develop different frequency-modulated circuit activities in parallel. We suggest that such differential entrainment of sensorimotor and associative neuronal populations, acquired through learning, could be critical for coordinating information flow throughout each trans-striatal network while simultaneously enabling nearby components of the separate networks to operate independently.

Keywords: dorsolateral; dorsomedial; electrophysiology; habit learning; oscillation; striatum.


Figures

Figure 1.
Figure 1.
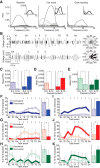
Behavioral task and single-unit recording. A, Histologically identified locations of tetrode tips in dorsolateral (top) and dorsomedial (bottom) striatum projected onto coronal sections representing the target coordinates (dorsolateral: AP = −0.5 mm; dorsomedial: AP = 1.7 mm from bregma); recording sites extended ∼±0.5 mm along the anterior-poster axis. B, Rats were trained on a T-maze task in which blocks of auditory (top) and tactile (bottom) trials were interleaved within daily sessions. Dashed line indicates location of auditory cue onset. Shading represents zone of tactile cue presentation. C, Percentage correct performance on auditory (dark gray) and tactile (light gray) task versions across training blocks defined according to percentage correct performance on the two versions of the task. Training Block A: sessions in which performance on both versions was <72.5% correct (dashed line). Training Block B: sessions in which auditory performance was >72.5% but tactile performance remained <72.5% correct. Training Block C: sessions in which performance on both versions was >72.5% correct. Boxes represent 25th to 75th percentiles. Whiskers represent most extreme data points. D, Recorded units were classified as putative FSIs (red) or MSNs (blue) by clustering according to wave-shape and firing rate criteria. TANs (green) were not distinguishable using these criteria. E, Putative TANs were separated from FSIs and MSNs according to bursting, ISI, and postspike suppression parameters (see Materials and Methods). F, Percentages of units classified as MSNs, FSIs, and TANs in dorsolateral (left) and dorsomedial (right) striatum in the population of neurons that included units repeated across multiple sessions. G, Percentages of units classified as MSNs, FSIs, and TANs after removing repeat units. H, Percentages of task-responsive units found in dorsolateral (light bars) and dorsomedial (dark bars) striatum for each subtype. Error bars indicate 95% confidence limits (bootstrap estimate, 1000 bootstraps).
Figure 2.
Figure 2.
Population activity of MSNs, FSIs, and TANs in dorsolateral and dorsomedial striatum. A, C, Session-averaged activity of dorsolateral (A) and dorsomedial (C) MSNs across task-time. Color plots (top) represent z-score normalized activity for each unit classified as MSN. Line plots (bottom) represent that average activity across all MSNs in each region is nearly identical during auditory (blue) and tactile trials (gray). Shading represents SEM. Dots above line plots indicate bins with significant difference between the two task versions (p < 0.05). BL, Baseline; W, warning click; Ga, gate opening; L, locomotion onset; S, out-of-start; C, cue onset; TS, turn start; TE, turn end; Go, goal-reaching. Scale bars for all plots are shown at bottom left of figure. B, D, The CV of population firing across task-time (top) and the percentage of task-responsive units (bottom) for MSNs recorded in the dorsolateral (B) and dorsomedial (D) striatum. Error bars indicate 95% confidence limits (bootstrap estimate, 1000 bootstraps). *p < 0.05. E, G, Same as in A, C for FSIs in dorsolateral (E) and dorsomedial (G) striatum. F, H, CV across training blocks (top) and MI comparing in-task firing rate to out-of-task firing rate (bottom) for FSIs in dorsolateral (F) and dorsomedial (H) striatum. I, K, Same as in A, C for TANs in dorsolateral (I) and dorsomedial (K) striatum. J, L, TANs in dorsolateral (J) and dorsomedial (L) striatum strengthen their phasic response to the warning click from Block A (“Early,” top) to Blocks B and C (“Late,” bottom). Perievent histogram represents population mean activity in 40 ms bins normalized on a 0–1 (minimum-maximum) scale. Gray lines indicate 95% confidence limits (bootstrap estimate, 1000 bootstraps). Red lines indicate expectation for a uniform firing distribution across the 15 bin window.
Figure 3.
Figure 3.
Dorsolateral and dorsomedial striatal recordings exhibit significant LFP power, LFP coherence, and spike-LFP entrainment within the theta band. A, Dorsolateral (top) and dorsomedial (bottom) LFPs exhibit similar task-related profiles (left) and average power (right) across a broad frequency range, dominated by theta-band peaks during task performance. Event codes as in Figure 2. B, Coherence between LFPs in the two regions peaks mid-task in the theta (5–12 Hz) range. C, D, Perievent raster plots and spike histograms across task-time (left) and spike-LFP coherence (right) for single FSIs recorded in dorsolateral (C) and dorsomedial (D) striatum. E, F, LFP power at both low-theta (5 Hz, E) and high-theta (10 Hz, F) frequencies exhibit similar dynamics across task performance in dorsolateral (gray) and dorsomedial (black) striatum. Error bars indicate SEM.
Figure 4.
Figure 4.
Dorsolateral and dorsomedial striatal subtypes are entrained to different theta-band frequencies. A, PPC for each recorded FSI in dorsolateral (light gray) and dorsomedial (dark gray) striatum across a range of center frequencies, computed for 2 s windows centered on baseline, cue onset, and goal-reaching. Insets, Mean PPC for dorsolateral and dorsomedial FSI populations. B, Single-unit examples illustrating spike occurrences at a consistent phase of LFP oscillations for a dorsolateral FSI entrained to ∼5 Hz (top) and dorsomedial FSI entrained to ∼10 Hz (bottom). C–E, Mean PPC for populations of MSNs (C, blue), FSIs (D, red), and TANs (E, green) in dorsolateral (left) and dorsomedial (right) striatum. Dorsolateral subtypes exhibit stronger low-theta than high-theta entrainment, whereas the opposite is true for dorsomedial subtypes. Error bars indicate bootstrap 95% confidence intervals (1000 bootstraps). *p < 0.05. F–H, Percentage of MSNs (F), FSIs (G), and TANs (H) entrained to low-theta (5 Hz) oscillations across nine different task events (left) and during one or more event intervals from locomotion onset to turn end (right). Error bars indicate bootstrap 95% confidence intervals (1000 bootstraps). *Significant increase (p < 0.05) above baseline percentages entrained. Event codes as in Figure 2. I–K, Same as F–H for MSNs (I), FSIs (J), and TANs (K) entrained to high-theta (10 Hz) oscillations. C–K, For all plots, lighter shading represents results for dorsolateral subtypes and darker shading represents results for dorsomedial subtypes.
Figure 5.
Figure 5.
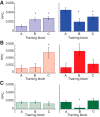
Strength of spike-LFP entrainment in dorsolateral and dorsomedial striatum to preferred theta-band rhythms is modulated across training blocks. A, Mean PPC and bootstrap 95% confidence intervals for MSN populations in dorsolateral (left, light blue) and dorsomedial (right, dark blue) striatum. *p < 0.05, relative to Block A. B, C, Same as in A for populations of FSIs (B) and TANs (C).
Figure 6.
Figure 6.
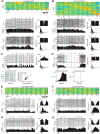
FSIs and TANs exhibit a variety of task-related activities. A, B, Z-score normalized, session-averaged activity for each FSI recorded in dorsolateral (A) and dorsomedial (B) striatum, sorted according to the time of maximum firing in-task (top) and perievent raster plots and histograms illustrating examples of task-related firing of FSIs (bottom) with corresponding autocorrelogram (top right) and ISI histogram (bottom right) for each FSI. Color and time scales for both heat plots shown in A. Event abbreviations as in Figure 2. C, Top, Task-related activity of a distinctive “rhythmic bursty” FSI recorded in dorsolateral striatum across several sessions. Bottom, Perievent raster plot centered on locomotion onset (time 0) with trials reordered according to the interevent time from locomotion onset to out-of-start events (left). Interburst interval (IBI) is strongly correlated with running time for this neuron phenotype (right). D, Top, As in C for a distinctive “task-bracketing” FSI found in the dorsomedial striatum. Bottom, Perievent histograms aligned on goal-reaching (time 0), illustrating that this FSI fires strongly as the animal approaches the right goal but remains silent for left goal approach. E, F, As in A, B for TANs recorded in dorsolateral (E) and dorsomedial (F) striatum. G, Task-related activity of a dorsolateral TAN that developed pause-rebound response to warning click and phasic activity after goal-reaching over several training sessions. H, A dorsomedial TAN that exhibited longer activity pauses after the warning click.
Figure 7.
Figure 7.
Subpopulations of neurons in dorsolateral and dorsomedial striatum show sensitivity to cue, action, and outcome task parameters. A, D, Percentage of MSNs (A) and FSIs (D) in dorsolateral (left) and dorsomedial (right) striatum that showed significantly higher firing rates during trials in which auditory (light shading) or during tactile (dark shading) cues were presented. B, E, As in A, D for MSNs (B) and FSIs (E) exhibiting higher firing rates during trials in which right turns (light shading) or left turns (dark shading) were performed. C, F, As in A, D for MSNs (C) and FSIs (F) exhibiting higher firing during rewarded (light shading) or unrewarded (dark shading) trials. F–H, As in A–C for all dorsolateral and dorsomedial TANs combined. For all panels, error bars indicate 95% bootstrap confidence limits (1000 bootstraps) and are present only for events for which the percentage of discriminative neurons was significantly greater (p < 0.05) than both the 5% level expected by chance and the results obtained for shuffled data. Gray shading represents task events during which a significant interaction (p < 0.0056, Fisher's Exact test) was found between differential firing and theta-band entrainment. B, Dashed gray box indicates task event during which such an interaction was a nonsignificant trend (p = 0.035).
Figure 8.
Figure 8.
Schematic model illustrating dynamic changes in both ensemble activation and spike-LFP entrainment across learning. Early in training, activity of MSNs conveying information to downstream basal ganglia targets is weakly structured in the sensorimotor striatum, and local spiking activity is weakly entrained to low-theta oscillations. At the same time, MSNs in the associative striatum increase their patterned activation and are strongly entrained to high-theta rhythms, suggesting dominance of the associative trans-striatal loop in the control of motor output. Late in training, the reduction in both structured ensemble activity and high-theta entrainment by the associative striatal network may permit the sensorimotor network to drive the execution of now-habitual behavior via strongly patterned ensemble activity that is entrained to low-theta rhythms. Broken arrows indicate multisynaptic connections from striatum to neocortex through pallidum and thalamus. MC, Motor cortex; PFC, prefrontal cortex; DLS, dorsolateral striatum; DMS, dorsomedial striatum.

References

    1. Alexander GE, DeLong MR, Strick PL. Parallel organization of functionally segregated circuits linking basal ganglia and cortex. Annu Rev Neurosci. 1986;9:357–381. doi: 10.1146/annurev.ne.09.030186.002041. - DOI - PubMed
    1. Aosaki T, Kimura M, Graybiel AM. Temporal and spatial characteristics of tonically active neurons of the primate's striatum. J Neurophysiol. 1995;73:1234–1252. - PubMed
    1. Balleine BW, O'Doherty JP. Human and rodent homologies in action control: corticostriatal determinants of goal-directed and habitual action. Neuropsychopharmacology. 2010;35:48–69. doi: 10.1038/npp.2009.131. - DOI - PMC - PubMed
    1. Barnes TD, Kubota Y, Hu D, Jin DZ, Graybiel AM. Activity of striatal neurons reflects dynamic encoding and recoding of procedural memories. Nature. 2005;437:1158–1161. doi: 10.1038/nature04053. - DOI - PubMed
    1. Belluscio MA, Mizuseki K, Schmidt R, Kempter R, Buzsáki G. Cross-frequency phase–phase coupling between theta and gamma oscillations in the hippocampus. J Neurosci. 2012;32:423–435. doi: 10.1523/JNEUROSCI.4122-11.2012. - DOI - PMC - PubMed

Publication types

MeSH terms

LinkOut - more resources