. 2014 Feb 19;34(8):2967-78.
doi: 10.1523/JNEUROSCI.1948-13.2014.

N-acetyl-serotonin offers neuroprotection through inhibiting mitochondrial death pathways and autophagic activation in experimental models of ischemic injury

Affiliations

N-acetyl-serotonin offers neuroprotection through inhibiting mitochondrial death pathways and autophagic activation in experimental models of ischemic injury

Hua Zhou et al. J Neurosci. .

Abstract

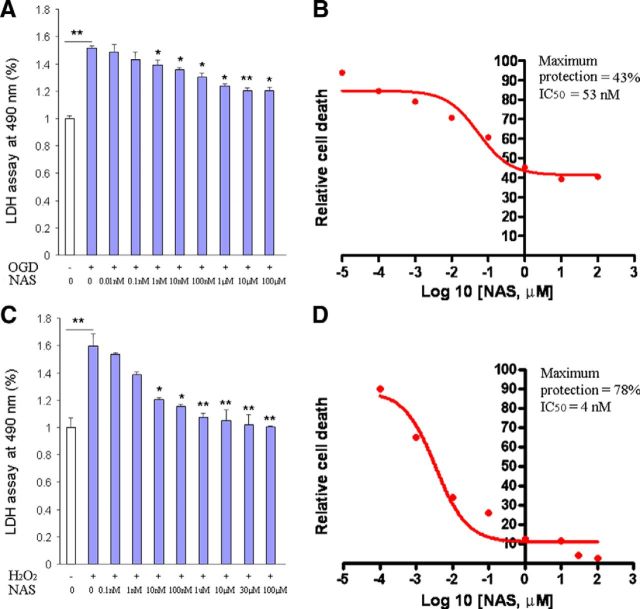
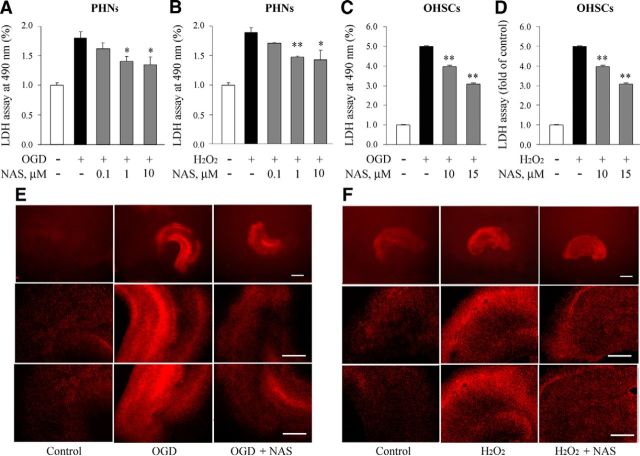
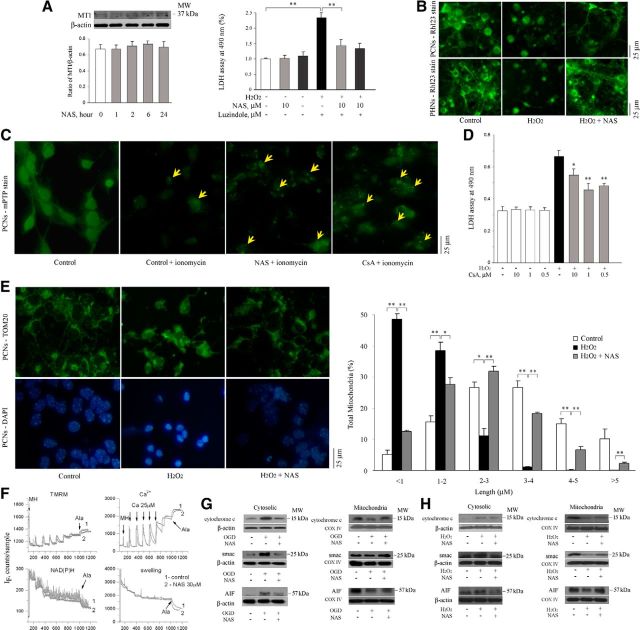
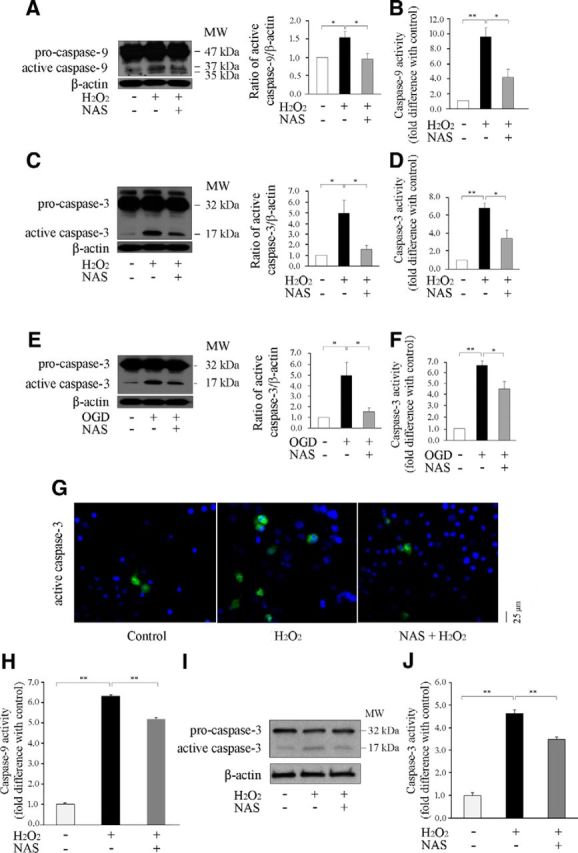
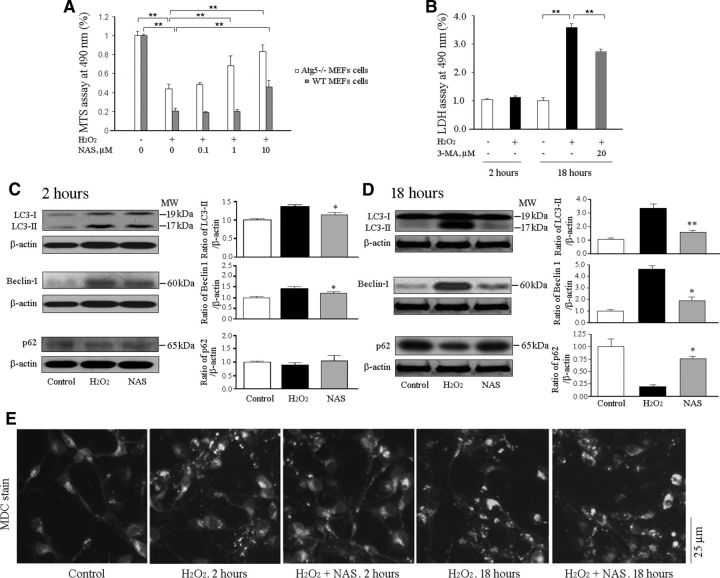
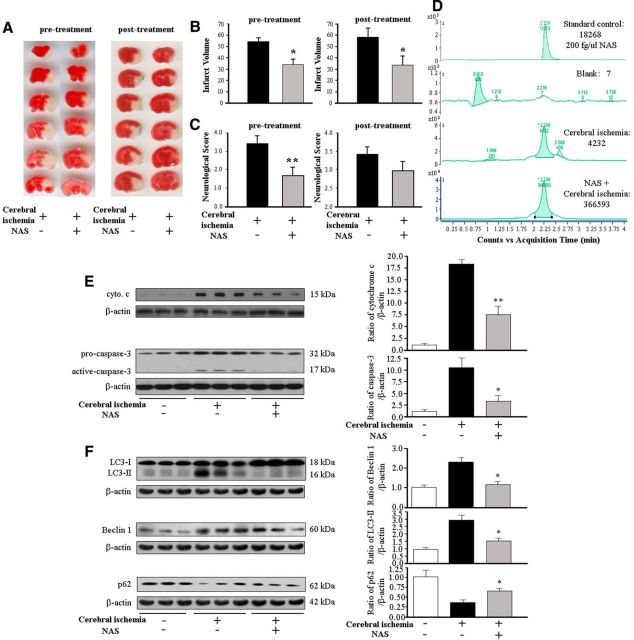
N-acetylserotonin (NAS) is an immediate precursor of melatonin, which we have reported is neuroprotective against ischemic injury. Here we test whether NAS is a potential neuroprotective agent in experimental models of ischemic injury. We demonstrate that NAS inhibits cell death induced by oxygen-glucose deprivation or H2O2 in primary cerebrocortical neurons and primary hippocampal neurons in vitro, and organotypic hippocampal slice cultures ex vivo and reduces hypoxia/ischemia injury in the middle cerebral artery occlusion mouse model of cerebral ischemia in vivo. We find that NAS is neuroprotective by inhibiting the mitochondrial cell death pathway and the autophagic cell death pathway. The neuroprotective effects of NAS may result from the influence of mitochondrial permeability transition pore opening, mitochondrial fragmentation, and inhibition of the subsequent release of apoptogenic factors cytochrome c, Smac, and apoptosis-inducing factor from mitochondria to cytoplasm, and activation of caspase-3, -9, as well as the suppression of the activation of autophagy under stress conditions by increasing LC3-II and Beclin-1 levels and decreasing p62 level. However, NAS, unlike melatonin, does not provide neuroprotection through the activation of melatonin receptor 1A. We demonstrate that NAS reaches the brain subsequent to intraperitoneal injection using liquid chromatography/mass spectrometry analysis. Given that it occurs naturally and has low toxicity, NAS, like melatonin, has potential as a novel therapy for ischemic injury.


Figures

Figure 1.
Figure 1.
Neuroprotective effects of NAS on the cell death of PCNs. Cell death was induced by 3 h exposure to OGD (A, B) or 18 h exposure to 1000 μmol/L H2O2 (C, D) with or without a series of concentrations of NAS. PCNs were preincubated with NAS for 2 h. Cell death was evaluated by LDH assay (A, C). Data from three independent experiments are presented, and statistically significant differences are indicated with *p < 0.05 and **p < 0.01. The resulting curves (plotted semilogarithmically) define the IC50 and maximum protection calculated by GraphPad Prism program (B, D).
Figure 2.
Figure 2.
NAS attenuates neuronal cell death in PHNs and OHSCs. Neuronal cell death of PHNs and OHSCs induced by 3 h OGD or 18 h H2O2 (1000 μmol/L for PHNs and 1500 μmol/L for OHSCs) with or without NAS was evaluated by the LDH assay (A–D). PHNs (A, B) and OHSCs (C, D) were preincubated with NAS for 2 h. Data from three independent experiments are graphed, and statistically significant differences are indicated with *p < 0.05 and **p < 0.01. NAS (15 μm) inhibited cell death in OHSCs exposed to OGD (E) and H2O2 (F), and PI fluorescence images were obtained. Hippocampal slices under normal control conditions displaying background PI fluorescence (E, F, left). Intense PI labeling in OHSCs exposed to OGD and H2O2 mainly occurred in the CA1, CA3 pyramidal cell field as well as dentate gyrus (E, F, middle). NAS significantly attenuated PI labeling, demonstrating neuroprotective effects (E, F, right). Scale bars: top lanes, 0.5 mm; middle and bottom lanes, 0.1 mm.
Figure 3.
Figure 3.
NAS does not activate MT1 but slows the dissipation of ΔΨm, influences the opening of mPTP, and reduces the release of mitochondrial apoptogenic factors during H2O2- and/or OGD-induced cell death. PCNs were treated with NAS for 0, 1, 2, 6, and 24 h. Whole cells were extracted and analyzed by Western blotting using antibody to MT1. β-Actin was used as loading control. This blot is representative of three independent experiments. Densitometry was performed to quantify the intensity of the bands from the three independent experiments (A, left). PCNs (A, right; B, top) and PHNs (B, bottom) were subjected to 1000 μmol/L H2O2 for 18 h with or without NAS (10 μmol/L; B) or luzindole (A, right). The supernatants were collected for LDH assay (A, right); **p < 0.01. The living cells were then stained with 2 μmol/L Rh 123 to determine the electrostatic charge of the mitochondria (B). PCNs were submitted for Image It Live mPTP assay (C). PCNs were coincubated with 10 μmol/L NAS or CsA and loaded with calcein AM and CoCl2 for 15 min, and 1 μmol/L ionomycin was then added. Tests of mPTP activation were conducted and digital images were taken (C). Cell death was induced in PCNs by 18 h exposure to 1000 μmol/L H2O2 with or without indicated concentrations of CsA and evaluated by LDH assay (D). Statistically significant differences (n = 6) are indicated with *p < 0.05 and **p < 0.01. The representative images of mitochondria stained for TOM20 (E, top) and matched DAPI images for nuclei (E, bottom) were shown and the quantitation of mitochondrial fragmentation was measured (E, right). The data represent the three independent experiments. *p < 0.05 and **p < 0.01. Brain mitochondria (0.25 mg/ml) energized with glutamate/malate 5 mmol/l were challenged with a series of Ca2+ additions (25 μm each) until they began to spontaneously release Ca2+ (F). Changes in ΔΨm (F, left) and absorbance (F, rightl), as indicators of mitochondrial swelling and induction of mPT, were monitored simultaneously. Pore-forming agent Alameticin (Ala) was added in the end of each sample. NAS (30 μm) was added 1 min before Ca2+ addition. Cell death was induced by subjecting PCNs to OGD for 3 h (G) or 1000 μmol/L H2O2 for 18 h (H) with or without 10 μmol/L NAS (G, H). Subsequently, cells were extracted, and either cytosolic components (G, H, left) or mitochondrial lysates (G, H, right) were obtained and analyzed by Western blotting using antibodies to cyto. c, Smac, and AIF. β-Actin and COX IV were used as cytosolic and mitochondrial component loading controls, respectively. This blot is representative of three independent experiments. Scale bars, 5 μm.
Figure 4.
Figure 4.
NAS inhibits activation of caspase-9 and -3 in PCNs and OHSCs. Cell death of PCNs and OHSCs was induced by subjecting PCNs to 1000 μmol/L H2O2 for 18 h (AD, G) and subjecting OHSC to 1500 μmol/L H2O2 for 18 h (HJ), or 3 h OGD (E, F) with or without 10 μmol/L NAS. Whole-cell lysates were extracted, and samples were analyzed by Western blot (each of which contained 50 μg protein) using antibodies to caspase-9 and -3 (A, C, F, I). β-Actin was used as a loading control. The blots are representative of three independent experiments. Densitometry was performed to quantify the intensity of the bands from the three independent experiments. Caspase-3 and -9 activities were also quantified using a fluorogenic assay in lysed PCNs (B, D, F) and OHSCs (H, J). Results come from at least three independent experiments; *p < 0.05, **p < 0.01. Nuclei of PCNs were stained with Hoechst 33342, whereas immunostaining showed that the increased active caspase-3 in H2O2 insult was reduced by the administration of NAS (G).
Figure 5.
Figure 5.
NAS inhibits autophagic cell death in vitro. Atg5−/− MEFs and Atg5+/+ MEFs (A), and PCN (B) cell death were induced by 2 h or 18 h exposure as indicated to 1000 μmol/L H2O2, with or without a series of indicated concentrations of NAS as well as 20 μmol/L 3-MA. Cells were preincubated with NAS or 3-MA for 2 h. Cell viability was evaluated by MTS assay (A) and cell death was quantified by LDH assay (B). Statistically significant differences (n = 6–8) are indicated with *p < 0.05 and **p < 0.01. The data are presented as mean ± SEM. Autophagy induced by subjecting PCNs to 2 h (C, E) or 18 h (D, E) H2O2 (1000 μmol/L) with or without 10 μmol/L NAS. PCNs were treated by the administration of 10 μmol/L NAS for 2 and 18 h. Whole-cell lysates were extracted, and samples were analyzed by Western blot (each of which contained 50 μg protein) using antibodies to LC3, Beclin-1, and p62. β-Actin was used as a loading control. The blots are representative of three independent experiments (C, D). Densitometry was performed to quantify the intensity of the bands from the three independent experiments; *p < 0.05, **p < 0.01. Autophagy of PCNs was assessed by 20 μm MDC stain. Autophagic vacuoles were labeled by MDC staining (E).
Figure 6.
Figure 6.
NAS diminishes damage from cerebral ischemia. Lesion size (A, B) and neurological scores (C) were determined for mice injected with saline (controls) and NAS. NAS (10 mg/kg) was administered by intraperitoneal injection 10 min before and 20 min after the onset of MCAO (pretreatment) or 30 min after the onset of MCAO (post-treatment). Brains were quickly removed after 24 h of ischemia, cut into coronal sections, and stained with 2% TTC, and neurological scores were rated (C). The data are presented as mean ± SEM for the saline (n = 11 for pretreatment, n = 7 for post-treatment) and NAS groups (n = 7 for pretreatment, n = 8 for post-treatment); *p < 0.05, **p < 0.01. Male mice received pretreatment or post-treatment of 10 mg/kg NAS or vehicle (DF). Brain tissues were harvested 30 min after the injection. The processed homogenate samples from NAS-treated or vehicle-treated mice were tested by LC/MS to record the relative absorbance (D). After 12 h of MCAO, the brains were removed and the ischemic territory was dissected; either cytosolic fractions were analyzed by Western blotting with antibodies against cyto. c/Smac/AIF (E, top), or whole-cell lysates were analyzed with antibodies to caspase-3 (E, bottom) or Beclin-1, LC3, and p62 (F) and reprobed with anti-β-actin. Densitometric scans of these gels quantified the intensity of the bands (each of which contained 50 μg proteins); *p < 0.05, **p < 0.01.

References

    1. Aguiar LM, Macedo DS, de Freitas RM, de Albuquerque Oliveira A, Vasconcelos SM, de Sousa FC, de Barros Viana GS. Protective effects of N-acetylserotonin against 6-hydroxydopamine-induced neurotoxicity. Life Sci. 2005;76:2193–2202. doi: 10.1016/j.lfs.2004.09.035. - DOI - PubMed
    1. Azad MB, Chen Y, Henson ES, Cizeau J, McMillan-Ward E, Israels SJ, Gibson SB. Hypoxia induces autophagic cell death in apoptosis-competent cells through a mechanism involving BNIP3. Autophagy. 2008;4:195–204. - PMC - PubMed
    1. Bai JZ, Lipski J. Differential expression of TRPM2 and TRPV4 channels and their potential role in oxidative stress-induced cell death in organotypic hippocampal culture. Neurotoxicology. 2010;31:204–214. doi: 10.1016/j.neuro.2010.01.001. - DOI - PubMed
    1. Baranov SV, Stavrovskaya IG, Brown AM, Tyryshkin AM, Kristal BS. Kinetic model for Ca2+-induced permeability transition in energized liver mitochondria discriminates between inhibitor mechanisms. J Biol Chem. 2008;283:665–676. doi: 10.1074/jbc.M703484200. - DOI - PubMed
    1. Büki A, Okonkwo DO, Wang KK, Povlishock JT. Cytochrome c release and caspase activation in traumatic axonal injury. J Neurosci. 2000;20:2825–2834. - PMC - PubMed

Publication types

MeSH terms