. 2014 Feb 19;34(8):3042-55.
doi: 10.1523/JNEUROSCI.3781-13.2014.

Neural dynamics underlying target detection in the human brain

Affiliations

Neural dynamics underlying target detection in the human brain

Arjun K Bansal et al. J Neurosci. .

Abstract

Sensory signals must be interpreted in the context of goals and tasks. To detect a target in an image, the brain compares input signals and goals to elicit the correct behavior. We examined how target detection modulates visual recognition signals by recording intracranial field potential responses from 776 electrodes in 10 epileptic human subjects. We observed reliable differences in the physiological responses to stimuli when a cued target was present versus absent. Goal-related modulation was particularly strong in the inferior temporal and fusiform gyri, two areas important for object recognition. Target modulation started after 250 ms post stimulus, considerably after the onset of visual recognition signals. While broadband signals exhibited increased or decreased power, gamma frequency power showed predominantly increases during target presence. These observations support models where task goals interact with sensory inputs via top-down signals that influence the highest echelons of visual processing after the onset of selective responses.

Keywords: attentional modulation; cognitive neuroscience; extrastriate cortex; human neurophysiology; target detection; visual recognition.


Figures

Figure 1.
Figure 1.
Experiment description and behavioral performance. A, Each block of 50 trials started with a screen indicating one of five target categories (Animal, Car, Chair, Face, or House). Each trial consisted of image presentation for 100 ms followed by subject response. The image contained one or two objects presented above and/or below the fixation spot (see top left inset). There were 25 possible objects, 5 per category. In 1/3 of the trials the target category for that block was present. Subjects had 1000 ms (subjects 1–3) or unlimited time (subjects 4–10) to respond. The response was either a button press only when target was present (subjects 1–3), or two distinct buttons for target present versus target absent (subjects 4–10). Trial order within a block and target categories across blocks were randomized. B, Behavioral performance (percentage correct) for each subject for target present (black) versus target absent (gray) trials. Error bars indicate 1 SD. The black dashed line indicates the mean percentage correct across all subjects (mean ± SD = 92 ± 7%). Numbers on top report the number of blocks for each subject. If subjects randomly reported target present or target absent with equal probability, performance would be 50% (middle dashed line). If subjects randomly reported target present with 1/3 probability and target absent with 2/3 probability then the percentage correct would be 67% in target absent trials and 33% in target present trials (top and bottom dotted lines, respectively). C, Mean reaction time for each subject (for all trials where the reaction time was <2.0 s and >0.2 s; see Materials and Methods) for target present (black) versus target absent (gray) trials. Error bars indicate 1 SD. The dashed line plots the mean RT across all subjects (mean ± SD = 775 ± 299 ms). Subjects 1–3 did not press a button for target absent trials.
Figure 2.
Figure 2.
Example electrode showing differential responses between target present and target absent trials. A, Example IFP responses from an electrode located in the inferior temporal gyrus (Talairach coordinates = [−46.2,−3.8,−39.1], see G) to three individual images containing object pairs eliciting strong, moderate, or weak modulation (black, target present; gray, target absent). B, Average responses from the same electrode in the presence (black, n = 485 trials) or absence (gray, n = 1015 trials) of the target. The curves show the mean IFP response averaged across all images, aligned to image onset, for correct trials only. Error bars indicate ± 1 SEM (shown only every 100 ms for clarity). The gray rectangle indicates the stimulus presentation time. The arrow indicates the mean RT. The vertical dashed line indicates the upper limit for the main analyses throughout the manuscript (600 ms). The thick, horizontal black bar indicates time points with a significantly different IFP between target present and target absent trials (two-sided t test, p < 0.01). C, The same responses are shown in a bipolar montage (subtracting the responses in the adjacent electrode). D, The same responses are plotted separately for each of the five categories depending on whether each category was the target (solid) or the target was absent (dashed) during the trial. Each color shows a separate stimulus category. The numbers indicate the numbers of target present and target absent trials for each curve. Note that for the target absent trials (dashed lines), the target category during the block could be any of the four other categories. Error bars are omitted in this plot for clarity; the trial-to-trial variability can be assessed from B and did not depend on the object category (Agam et al., 2010). E, Responses separated based on whether the image contained one object (thin lines) or two objects (thick lines). F, Responses separated based on whether the target was in the top (solid) or bottom (dashed) position. The target absent trace is the same as that in B and is reproduced here for comparison purposes. G, Electrode location (arrow) and location of three other electrodes on the same strip. H, Responses from the other three electrodes on the same strip (format as in B).
Figure 3.
Figure 3.
Second example electrode. Responses from a second example electrode located in the left fusiform gyrus (Talairach coordinates = [−29.8,−43.1 −17.3]). The format and conventions are as in Figure 2. A, Average responses from the same electrode in the presence (black, n = 303 trials) or absence (gray, n = 697 trials) of the target. B, The same responses are shown in a bipolar montage. C, The same responses are plotted separately for each of the five categories. D, Responses separated based on whether the image contained one object (thin lines) or two objects (thick lines). E, Responses separated based on whether the target was in the top (solid line) or bottom (dashed line) position. F, Electrode location (arrow) and location of seven other electrodes on the same strip. G, Responses from the other seven electrodes on the same strip (format as in A).
Figure 4.
Figure 4.
Responses of all target-modulated electrodes. Mean (±SEM) IFP responses, normalized by dividing by the maximum voltage, for target present (black) versus target absent (gray) trials for all the non-motor electrodes that showed target modulation in correct trials. The baseline IFP response (mean IFP between −50 and 0 ms before stimulus onset) was subtracted from each electrode's mean IFP response. Negative voltage responses (e.g., Fig. 3B) were reflected with respect to the y-axis before normalization to avoid directly averaging responses such as those in Figures 2 and 3. A, Electrodes above the diagonal in Figure 6A (n = 56, where power in target present trials > power in target absent trials). B, Electrodes below the diagonal in Figure 6A (n = 22, where power in target present trials < power in target absent trials). The number of trials varied across subjects (range of target present trials: 243–547; range of target absent trials: 555–1203).
Figure 5.
Figure 5.
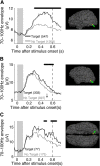
Example electrodes showing differential responses between target present and target absent trials in the gamma frequency band. Three example electrodes located in the inferior temporal gyrus (A, Talairach coordinates = [−57.4 8.5 10.9]), inferior occipital gyrus (B, [−49, −84.5, −1.4]), and fusiform gyrus (C, [−48.6, 32.6, −9.2]) showing responses in the gamma frequency band during target present (black) and target absent (gray) trials. The format and conventions follow those in Figure 2B except that here the y-axis represents the envelope of the IFP signal in the 70–100 Hz frequency band (see Materials and Methods). The mean reaction time (arrow) in A and C was after 800 ms.
Figure 6.
Figure 6.
Comparison of responses for target present versus target absent trials in seven frequency bands. Normalized root-mean squared power (average response from 200 to 550 ms after stimulus onset, normalized by the maximum value) for broadband signals (A) and six different frequency bands (B–G) in target present trials (y-axis) versus target absent trials (x-axis). Each circle denotes a separate electrode that showed target modulation. Error bars indicate 1 SEM. The diagonal line represents equal response for target present and target absent trials. A two-sided sign test determined significant asymmetry in the distribution of the points across the diagonal for the 4–8, 8–12, 35–50, and 70–100 Hz bands. The points marked with “x” represent the mean normalized power when target present and target absent trial identities were shuffled for each electrode (20 iterations); they provide an estimate of the deviations from the diagonal that can be expected by chance. The example electrodes from Figures 2, 3, and 5 are marked by arrows in A and G.
Figure 7.
Figure 7.
Electrode locations. Lateral view showing the location of sampled electrodes (black), electrodes in regions that showed modulation by target presence in both broadband and gamma band signals (yellow), electrodes in regions that showed modulation by target presence predominantly in broadband signals (blue), and electrodes in regions that showed modulation by target presence predominantly in gamma band signals (red). Only regions with >5 electrodes showing target modulation are shown in this figure (Table 1). All electrodes were mapped onto one subject's brain (subject 10) and reflected onto the left hemisphere for this illustration.
Figure 8.
Figure 8.
Differentiation between target present and target absent responses started after 250 ms poststimulus onset. For each electrode that showed a differential response between target present and target absent trials, we defined the target modulation latency as the first time point when a two-tailed t test between target present and target absent trials yielded p < 0.01 for at least 70 consecutive ms (FDR < 0.01; see Materials and Methods). The plots show the distribution of latencies using the broadband power (A, n = 78 electrodes) or the gamma power (B, n = 70 electrodes). The inverted triangles indicate the mean. The arrowheads indicate the examples from Figures 2, 3, and 5. Bin size = 50 ms. C, D, Mean (±SEM) target modulation latency in each region that had at least five target-modulated electrodes for the broadband responses (C), or the gamma frequency band responses (D). The numbers of target-modulated electrodes for each region are indicated on top of each bar.
Figure 9.
Figure 9.
Single-trial discrimination between target present and target absent trials. Decoding performance using the best 20 electrodes (A, B) or 20 random electrodes (C, D) in each of 10 regions with at least 20 sampled electrodes across nine subjects (see Materials and Methods). A linear discriminant analysis classifier was used to decode whether the target was present or absent in any given trial. At each time point t on the x-axis, the broadband (A, C), or gamma band (B, D) signals in the interval [−50,t] ms were used for classification. The classification performance reported on the y-axis is obtained from cross-validated test data. Error bars indicate ± 3 SEM. The 20 best electrodes were selected using only training data. The gray shaded region indicates chance levels between 0.5 − 3* (0.5 − min (shuffle distribution)) and 0.5 + 3* (max (shuffle distribution) − 0.5) as determined by a shuffling procedure (1000 iterations; see Materials and Methods).
Figure 10.
Figure 10.
Eye position was similar in target present and target absent trials. Eye position as a function of time from stimulus onset for subject 10. Each small circle denotes the eye positions (horizontal in x-axis and vertical in y-axis) during each trial in 100 ms intervals from the time of stimulus onset (first column) to 600 ms after stimulus onset (seventh column). The top four rows represent target present trials. The top two rows represent trials where only one object was presented (dark gray squares represent target location) above (row 1) or below (row 2) the fixation point. Rows 3 and 4 represent trials where two objects were presented (dark and light gray squares) with the target above (row 3) or below (row 4) the fixation point. Rows 5–7 represent target absent trials. Rows 5–6 represent trials where only one nontarget object was presented (light gray square) above (fifth row) or below (sixth row) the fixation point. Row 7 represents trials where two nontarget objects were presented (two light gray squares). The large circle represents a fixation window with a radius of 2 degrees (not present on the screen). Each subplot shows the percentage of trials where the subject fixated within that window (top number) and the percentage of trials where the subject's eye position was outside the [−8:8] degree square region plotted here (bottom number). Fixations and any subsequent eye movements were similar across target present and target absent trials.

Similar articles

Cited by

References

    1. Agam Y, Liu H, Papanastassiou A, Buia C, Golby AJ, Madsen JR, Kreiman G. Robust selectivity to two-object images in human visual cortex. Curr Biol. 2010;20:872–879. doi: 10.1016/j.cub.2010.03.050. - DOI - PMC - PubMed
    1. Allison T, Ginter H, McCarthy G, Nobre AC, Puce A, Luby M, Spencer DD. Face recognition in human extrastriate cortex. J Neurophysiol. 1994;71:821–825. - PubMed
    1. Anastassiou CA, Perin R, Markram H, Koch C. Ephaptic coupling of cortical neurons. Nat Neurosci. 2011;14:217–223. doi: 10.1038/nn.2727. - DOI - PubMed
    1. Bansal AK, Vargas-Irwin CE, Truccolo W, Donoghue JP. Relationships among low-frequency local field potentials, spiking activity, and three-dimensional reach and grasp kinematics in primary motor and ventral premotor cortices. J Neurophysiol. 2011;105:1603–1619. doi: 10.1152/jn.00532.2010. - DOI - PMC - PubMed
    1. Buzsáki G, Anastassiou CA, Koch C. The origin of extracellular fields and currents–EEG, ECoG, LFP and spikes. Nat Rev Neurosci. 2012;13:407–420. doi: 10.1038/nrn3241. - DOI - PMC - PubMed

Publication types

MeSH terms

LinkOut - more resources