. 2014 Feb 19;34(8):3056-66.
doi: 10.1523/JNEUROSCI.2563-13.2014.

The hippocampal CA2 ensemble is sensitive to contextual change

Affiliations

The hippocampal CA2 ensemble is sensitive to contextual change

Marie E Wintzer et al. J Neurosci. .

Abstract

Contextual learning involves associating cues with an environment and relating them to past experience. Previous data indicate functional specialization within the hippocampal circuit: the dentate gyrus (DG) is crucial for discriminating similar contexts, whereas CA3 is required for associative encoding and recall. Here, we used Arc/H1a catFISH imaging to address the contribution of the largely overlooked CA2 region to contextual learning by comparing ensemble codes across CA3, CA2, and CA1 in mice exposed to familiar, altered, and novel contexts. Further, to manipulate the quality of information arriving in CA2 we used two hippocampal mutant mouse lines, CA3-NR1 KOs and DG-NR1 KOs, that result in hippocampal CA3 neuronal activity that is uncoupled from the animal's sensory environment. Our data reveal largely coherent responses across the CA axis in control mice in purely novel or familiar contexts; however, in the mutant mice subject to these protocols the CA2 response becomes uncoupled from CA1 and CA3. Moreover, we show in wild-type mice that the CA2 ensemble is more sensitive than CA1 and CA3 to small changes in overall context. Our data suggest that CA2 may be tuned to remap in response to any conflict between stored and current experience.

Keywords: Arc; CA2; H1a; IEG; context learning; hippocampus.


Figures

Figure 1.
Figure 1.
Kinetics of Arc/H1a expression in CA2 are similar to CA1/CA3. A, We performed Arc/H1a in situ in wild-type mice at four time points (top to bottom rows: 0, 10, 30, and 60 min) following NMDA-induced seizure. High-magnification epifluorescent images (20×) were acquired from each of the three CA subfields; CA2 was identified by CACNG5 in situ of adjacent sections (left, CA1; center, CA2; right, CA3). Nuclear expression of Arc (green) was very low at the time of injection, but clearly peaks in all three regions 10 min later. H1a (red) also has low background expression, but peaks at the 30 min time point in all three regions. B, C, Triple in situ with probes for H1a, Arc, and CACNG5. B, Triple in situ with the H1a probe labeled with Fluorescein and the Arc and CACNG5 probes both labeled with digoxigenin (left, 5×; right, 20×). C, H1a and CACNG5 probes are labeled with fluorescein and the Arc probe is labeled with digoxigenin. D, E, Confocal z-stacks (60×, 7 μm thick) of CA2 in the triple-labeled sections; left image was acquired with high laser power to visualize the weak CACNG5 signal, the right image with the laser settings used for all quantification experiment. D, H1a probe labeled with fluorescein and the Arc and CACNG5 probes both labeled with digoxigenin, under the standardized settings used for quantification (right), the CACNG5 probe does not prevent clear visualization of the INFs. E, Same as in D, except now the H1a and CACNG5 probes are labeled with fluorescein and the Arc probe is labeled with digoxigenin.
Figure 2.
Figure 2.
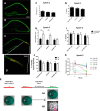
Exploratory behavior is altered in NR1-KO mice. A–D, We performed double FISH with a probe for NR1 (green) and CACNG5 (red). A, The 5× epifluorescent image of a coronal section of the dorsal hippocampus of the flNR1/flNR1 control mouse. B, The DG-NR1 KO mouse and the CA3-NR1 KO mouse (C). D, A high-magnification (20×) view of the CA3/CA2 border in the CA3-KO mouse. The loss of NR1 mRNA does not extend into the CA2 pyramidal cell layer. E, Protocol used for behavior and IEG expression experiments. F, Total distance traveled and percentage of the context sampled (G) during Epoch 1 finds no difference between genotypes.(CA3-NR1 KO n = 22; control, n = 23; DG-NR1 KO, n = 16; distance ANOVA; F(2,60) = 1.75, p = 0.1824; percentage coverage ANOVA; F(2,60) = 1.73, p = 0.1919). H, During Epoch2 the CA3-NR1 KO and control mice exposed to Box B (open bars; AB: CA3-NR1 KO, n = 10; control, n = 13; DG-NR1 KO, n = 8) explored significantly more than mice of the same genotype exposed to Box A (closed bars; AA: CA3-NR1 KO, n = 12; control, n = 10; DG-NR1 KO, n = 8), whereas DG-NR1 KO mice show no difference between protocols (two-way ANOVA F(1,32): protocol × genotype = 0.87, p = 0.43; F(1,2): protocol = 14.5, p = 0.0004; F(1,2): genotype = 4.4, p = 0.017; Bonferroni post-test CA3-KO AA × AB, p < 0.05, control AA × AB, p < 0.05; DG-KO AA × AB, p > 0.05). I, There was no difference across genotypes or protocols in the percentage of box sampled during Epoch2 (two-way ANOVA F(1,32): protocol × genotype = 0.18, p = 0.83; F(1,2): protocol = 0.03, p = 0.87; F(1,2): genotype = 1.5, p = 0.24) or (J) in the amount of overlap between the area explored across Epoch1 and Epoch2 (two-way ANOVA F(1,32): protocol × genotype = 0.41, p = 0.67; F(1,2): protocol = 3.2, p = 0.09; F(1,2): genotype = 1.5, p = 0.24). K, On a finer timescale all genotypes show significantly elevated exploration during the first minute in Box B, only the DG-NR1 KO mice show a significant decrease in exploration in the novel context between first and second minute in the context (two-way ANOVA F(1,2): protocol × genotype = 0.46, p = 0.63; F(1,2): protocol = 30.5, p < 0.0001; F(1,2): genotype = 0.9, p = 0.91; Bonferroni post-test minute 1 in AA vs minutes 1 in AB: CA3-KO AA × AB, p < 0.05, control AA × AB, p < 0.05, DG-KO AA × AB p < 0.01; minute 1 vs minute 2; CA3-KO, p > 0.05; control, p > 0.05; DG-NR1 KO, p < 0.01; *p < 0.05; **p < 0.01).
Figure 3.
Figure 3.
The loss of plasticity in DG and CA3 alters ensemble similarity across the CA subfields. A–C, Confocal stacks (60×) of CA2 (A, B) or the CA2/CA3 border (C). The diffuse green signal seen in (A1C1) is the signal from the CACNG5 probe. In the stacks used for counting positive nuclei (A2C2) the laser and PMT settings were adjusted to exclude this weaker diffuse signal while leaving the strong Arc INF signal intact; each panel includes a digitally zoomed image on single-positive cell. Identical settings were also used for CA1 (D) and CA3 (E) image collection to assure equal detection across subregions. Each panel contains a z-stack of seven 1 μm optical sections. DAPI signal visualized in blue, H1a probe in red, Arc probe in green and CACNG5 probe in green. Red arrows indicate example H1a+ nuclei, green arrows example Arc+ nuclei and yellow arrows example double-positive nuclei. F–H, Averaged group similarity data organized by genotype, subregion and protocol (mean ± SEM; blue bars AA protocols, red bars AB protocol). F, In the CA3-NR1 KO mice there was only a significant similarity difference in CA1 (AA: CA1, n = 5; CA2, n = 7; CA3, n = 5; AB: CA1, n = 8; CA2, n = 7; CA3, n = 9; two-way ANOVA F(1,2): protocol × subregion = 5.69, p = 0.0073; Bonferroni post-test CA3 AA × AB, p > 0.05; CA2 AA × AB, p > 0.05; CA1 AA × AB p < 0.001). G, In control mice there is a significant difference between protocols in all three CA regions (AA: CA1 n = 6; CA2, n = 7; CA3, n = 6; AB: CA1, n = 9; CA2, n = 7; CA3, n = 9; two-way ANOVA F(1,2): protocol × subregion = 2.05, p = 0.14; F(1,2): protocol = 38.6, p < 0.0001; F(1,2): subregion = 2.75, p = 0.08; Bonferroni post-test CA3 AA × AB, p < 0.0001; CA2 AA × AB, p < 0.05; CA1 AA × AB, p < 0.05). H, Whereas in the DG-NR1 KO mice there is a difference in CA1 and CA2, but not CA3 (AA: CA1, n = 5; CA2, n = 6; CA3, n = 5; AB: CA1, n = 6; CA2, n = 5; CA3, n = 6; two-way ANOVA F(1,2): protocol × subregion = 1.99, p = 0.16; F(1,2): protocol = 36.9, p < 0.0001; F(1,2): subregion = 33.9, p < 0.0001; Bonferroni post-test CA3 AA × AB, p > 0.05; CA2 AA × AB, p < 0.0001; CA1 AA × AB p < 0.05).
Figure 4.
Figure 4.
Subtle contextual changes lead to remapping specifically in CA2. A, The protocol used for the AA′ and AB′ experiments. B, Comparing exploration between Epoch 1 and Epoch 2 across all four protocols finds a significant interaction between epoch and protocol (AA, n = 7; AA′, n = 9; AB′, n = 8; AB, n = 10; two-way ANOVA F(1,3): protocol × epoch = 12.52, p < 0.0001; Bonferroni post-test Epoch1 × Epoch2: AA, p > 0.05; AA′, p > 0.05; AB′, p < 0.0001; AB, p < 0.0001). The wild-type mice exposed to Box B (AB′, AB) explored significantly more during Epoch 2. C, Comparison of similarity scores by subregion across all four protocols used, varying in degree of contextual change from left to right (AA, blue bars; AA′, light blue bars; AB′, light red bars; AB, red bars; AA, n = 7; AA′, n = 9; AB′, n = 8; AB, n = 10; two-way ANOVA F(1,6): protocol × region = 1.65, p = 0.143; F(1,3): protocol = 17.9, p < 0.0001; F(1,2): subregion = 7.06, p = 0.0015; CA1 Bonferroni's multiple-comparison post-test; AA vs AA′, p > 0.05; AA vs AB′, p > 0.05; AA vs AB, p < 0.005; AA′ vs AB′, p > 0.05; AA′ vs AB, p > 0.05; AB′ vs AB p > 0.05; CA2 Bonferroni's multiple-comparison post-test; AA vs AA′, p < 0.05; AA vs AB′, p < 0.005; AA vs AB, p < 0.001; AA′ vs AB′, p > 0.05; AA′ vs AB′, p > 0.05; AB′ vs AB, p > 0.05; CA3 Bonferroni's multiple-comparison post-test; AA vs AA′, p < 0.0001; AA vs AB′, p < 0.001; AA vs AB, p < 0.0001; AA′ vs AB′, p > 0.05; AA′ vs AB′, p > 0.05; AB′ vs AB, p < 0.05; ****p < 0.0001, ***p < 0.001, **p < 0.01, *p < 0.05). D–F, Scatter plots of similarity scores of individual mice across pairs of regions. Thick line is the 45° line representing the x = y condition (AA, n = 7; AA′, n = 9; AB′, n = 8; AB, n = 10; blue circles, AA; light blue square, AA′; light red triangle, AB′; red triangle, AB). D, CA1 versus CA3, many points cluster around the 45° line, indicating coherent changes across these regions. E, CA1 versus CA2 and (F) CA2 versus CA3 condition most points from the AA′ and AB′ are below the 45° line, suggesting relatively greater remapping in CA2 than CA3 and CA1.

Similar articles

Cited by

References

    1. Bartesaghi R, Gessi T. Parallel activation of field CA2 and dentate gyrus by synaptically elicited perforant path volleys. Hippocampus. 2004;14:948–963. doi: 10.1002/hipo.20011. - DOI - PubMed
    1. Benes FM, Kwok EW, Vincent SL, Todtenkopf MS. A reduction of nonpyramidal cells in sector CA2 of schizophrenics and manic depressives. Biol Psychiatry. 1998;44:88–97. doi: 10.1016/S0006-3223(98)00138-3. - DOI - PubMed
    1. Carninci P, Carninci P, Kasukawa T, Katayama S, Gough J, Frith MC, Maeda N, Oyama R, Ravasi T, Lenhard B, Wells C, Kodzius R, Shimokawa K, Bajic VB, Brenner SE, Batalov S, Forrest AR, Zavolan M, Davis MJ, Wilming LG, et al. The transcriptional landscape of the mammalian genome. Science. 2005;309:1559–1563. doi: 10.1126/science.1112014. - DOI - PubMed
    1. Chevaleyre V, Siegelbaum SA. Strong CA2 pyramidal neuron synapses define a powerful disynaptic cortico-hippocampal loop. Neuron. 2010;66:560–572. doi: 10.1016/j.neuron.2010.04.013. - DOI - PMC - PubMed
    1. Clelland CD, Choi M, Romberg C, Clemenson GD, Jr, Fragniere A, Tyers P, Jessberger S, Saksida LM, Barker RA, Gage FH, Bussey TJ. A functional role for adult hippocampal neurogenesis in spatial pattern separation. Science. 2009;325:210–213. doi: 10.1126/science.1173215. - DOI - PMC - PubMed

Publication types

MeSH terms

Substances

LinkOut - more resources