Comparative Study
. 2014 Apr;20(4):462-73.
doi: 10.1261/rna.043752.113. Epub 2014 Feb 19.

Distinctive kinetics and substrate specificities of plant and fungal tRNA ligases

Comparative Study

Distinctive kinetics and substrate specificities of plant and fungal tRNA ligases

Barbara S Remus et al. RNA. 2014 Apr.

Abstract

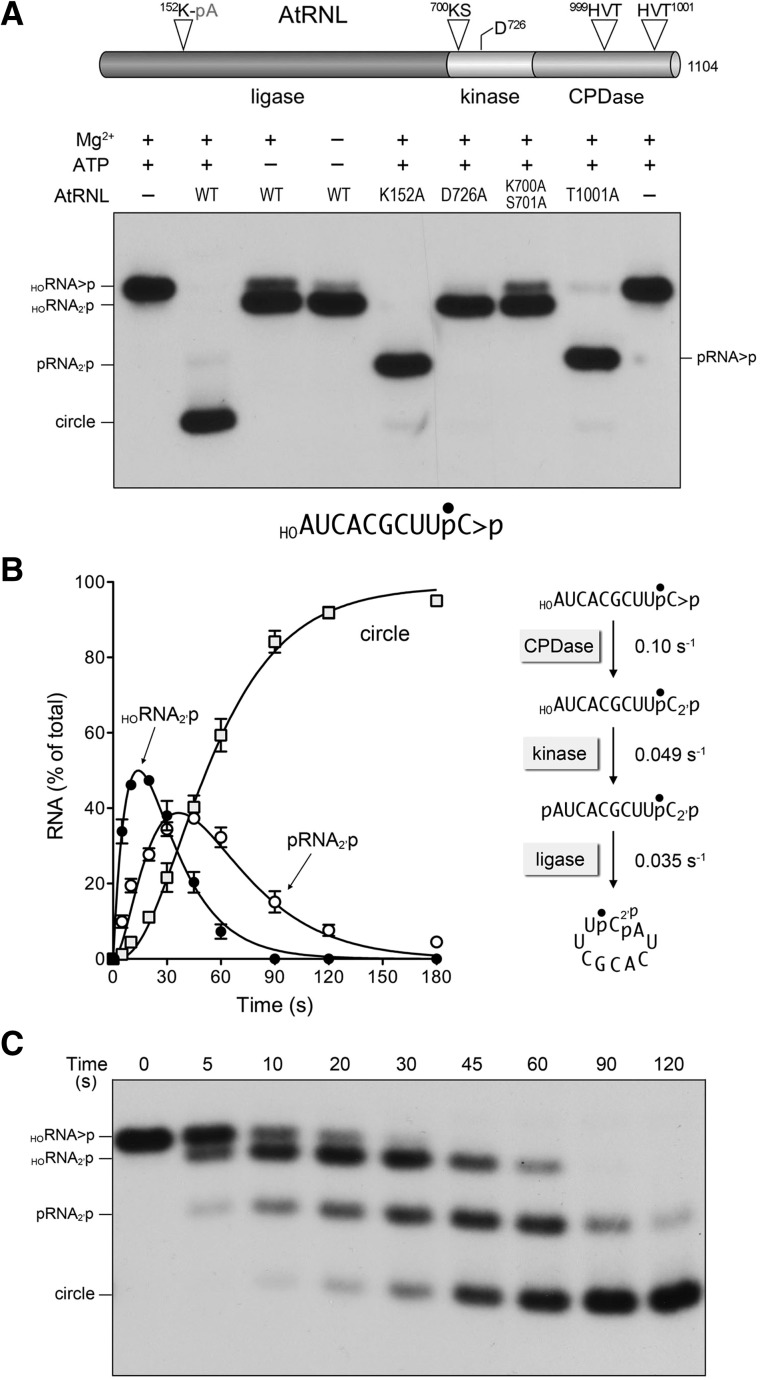
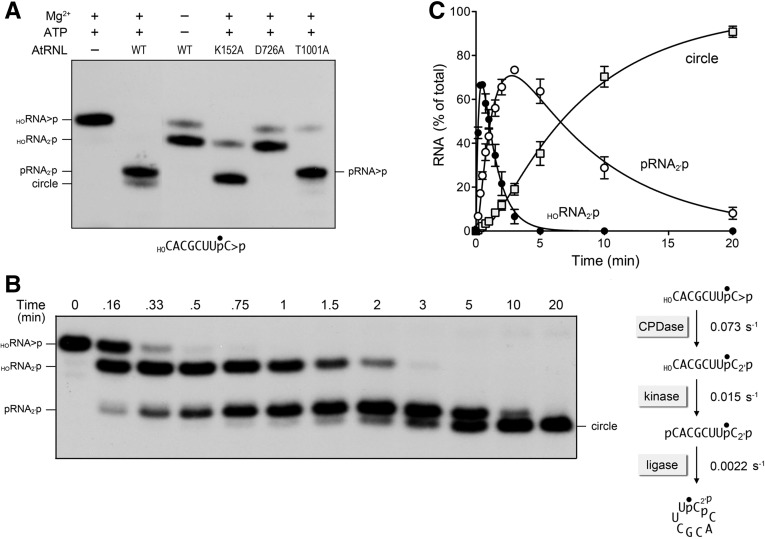
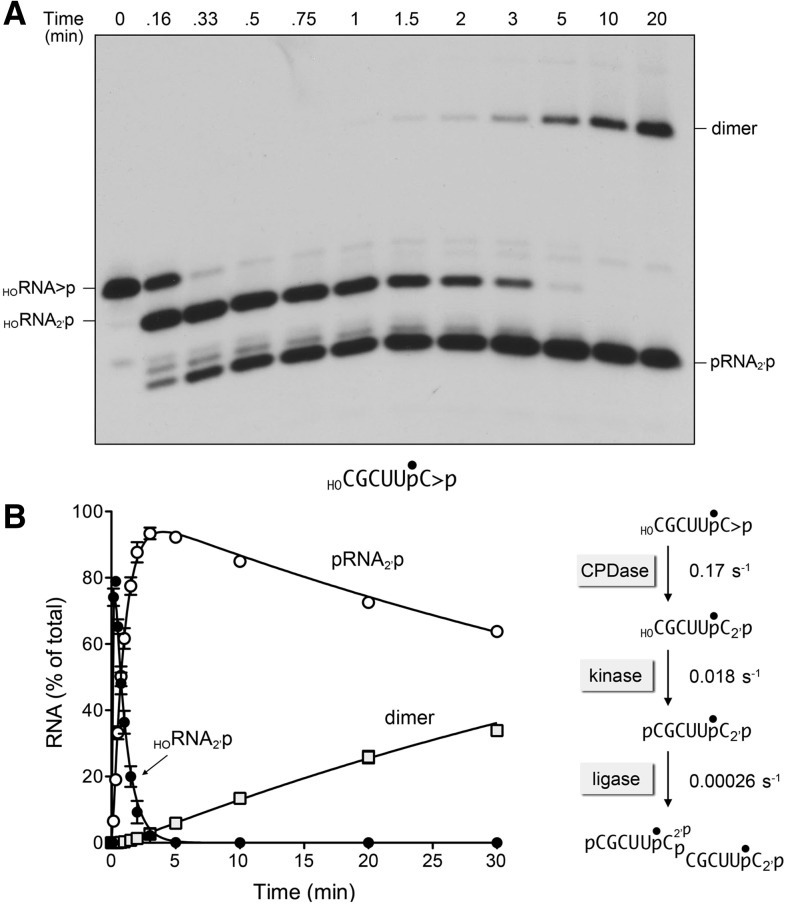
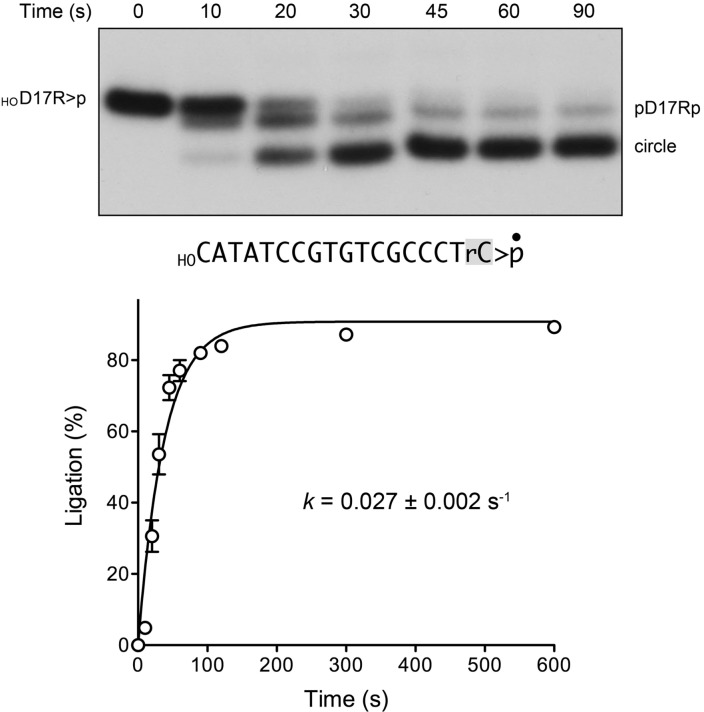
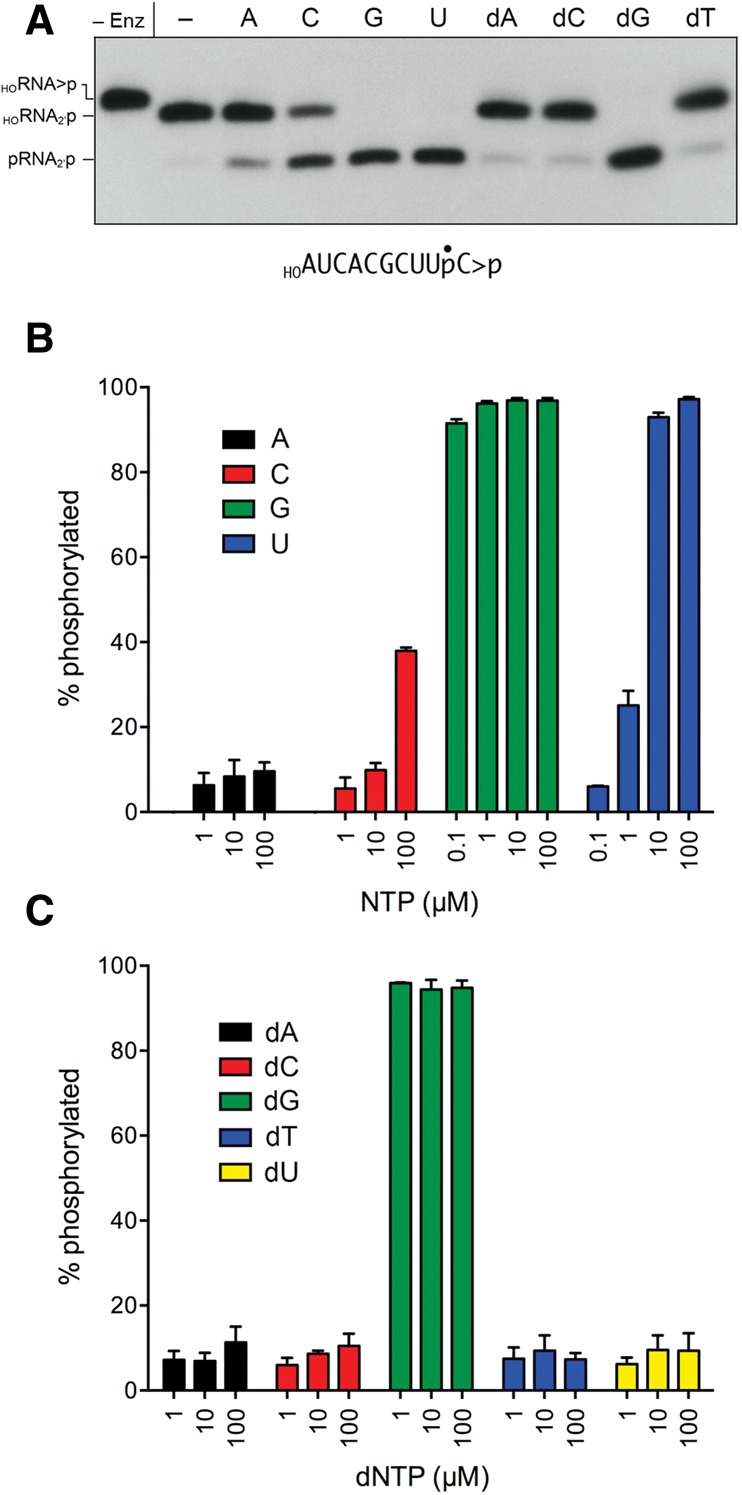
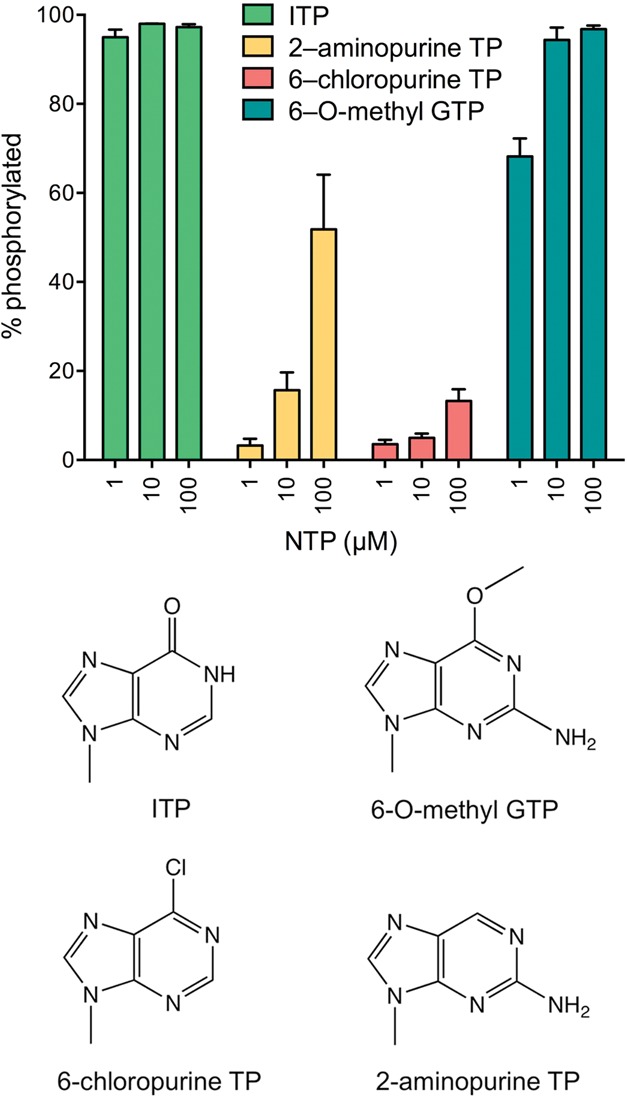
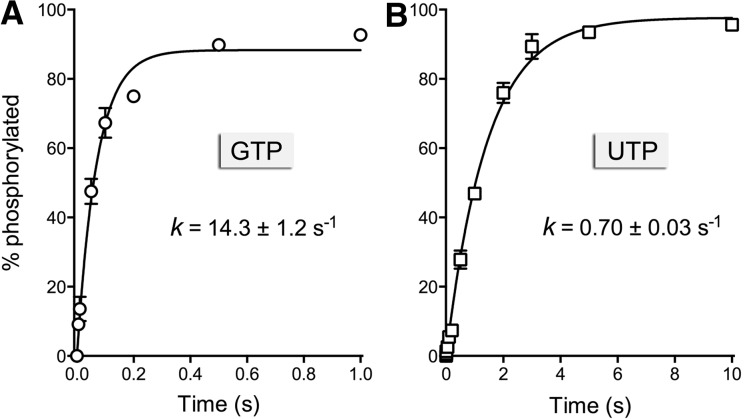
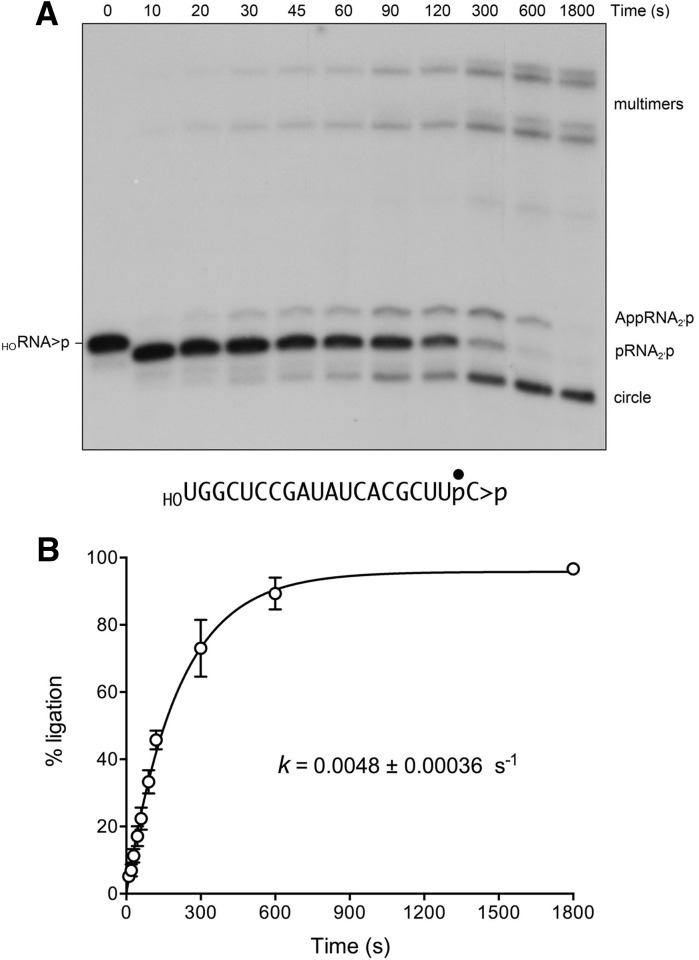
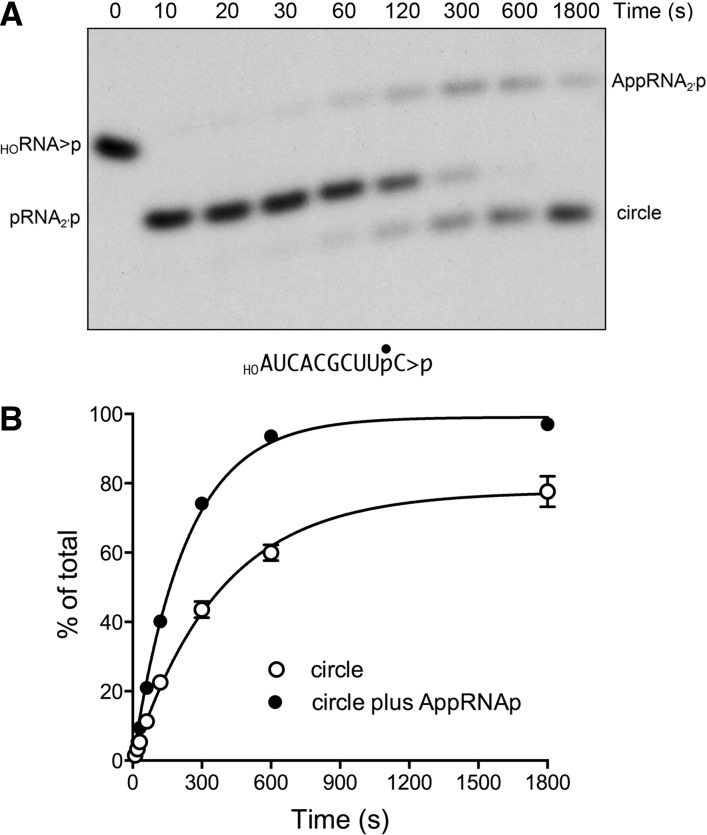
Plant and fungal tRNA ligases are trifunctional enzymes that repair RNA breaks with 2',3'-cyclic-PO4 and 5'-OH ends. They are composed of cyclic phosphodiesterase (CPDase) and polynucleotide kinase domains that heal the broken ends to generate the 3'-OH, 2'-PO4, and 5'-PO4 required for sealing by a ligase domain. Here, we use short HORNA>p substrates to determine, in a one-pot assay format under single-turnover conditions, the order and rates of the CPDase, kinase and ligase steps. The observed reaction sequence for the plant tRNA ligase AtRNL, independent of RNA length, is that the CPDase engages first, converting HORNA>p to HORNA2'p, which is then phosphorylated to pRNA2'p by the kinase. Whereas the rates of the AtRNL CPDase and kinase reactions are insensitive to RNA length, the rate of the ligase reaction is slowed by a factor of 16 in the transition from 10-mer RNA to 8-mer and further by eightfold in the transition from 8-mer RNA to 6-mer. We report that a single ribonucleoside-2',3'-cyclic-PO4 moiety enables AtRNL to efficiently splice an otherwise all-DNA strand. Our characterization of a fungal tRNA ligase (KlaTrl1) highlights important functional distinctions vis à vis the plant homolog. We find that (1) the KlaTrl1 kinase is 300-fold faster than the AtRNL kinase; and (2) the KlaTrl1 kinase is highly specific for GTP or dGTP as the phosphate donor. Our findings recommend tRNA ligase as a tool to map ribonucleotides embedded in DNA and as a target for antifungal drug discovery.

Keywords: 2′,3′ cyclic phosphodiesterase; RNA ligase; RNA repair; polynucleotide kinase.


Figures

FIGURE 1.
FIGURE 1.
One-pot assay for monitoring the AtRNL end-healing and sealing reactions. (A) Arabidopsis tRNA ligase is composed of an N-terminal ligase module, a central 5′ kinase module, and a C-terminal CPDase module, depicted as a cartoon model at the top of the panel. The site of covalent adenylylation at the ligase active site, the P-loop motif and aspartate general base at the kinase active site, and the two HxT motifs that comprise the CPDase active site are highlighted. AtRNL mutants with inactivating alanine substitutions in each of the three catalytic modules were reacted with a 3′ 32P-labeled 10-mer HORNA>p substrate (depicted at the bottom of the panel with the 32P-label denoted by •). Reaction mixtures (20 µL) containing 50 mM Tris-HCl, pH 8.0, 2 mM DTT, 10 mM MgCl2, 100 µM ATP, 20 nM 10-mer HORNA>p, and 1 µM AtRNL (wild type or mutant as specified) were incubated for 5 min at 22°C. Individual reaction components were included (+) or omitted (−) as specified. The reactions were quenched with an equal volume of 90% formamide, 30 mM EDTA. The products were analyzed by electrophoresis through a 20% polyacrylamide gel containing 7 M urea in TBE. An autoradiograph of the gel is shown. The position and identities of the radiolabeled RNA substrate and the various healed or sealed products are indicated on the left and right. (B,C) Order and kinetic profile of the splicing reactions under single-turnover conditions. A reaction mixture (200 µL) containing 50 mM Tris-HCl, pH 8.0, 50 mM NaCl, 2 mM DTT, 10 mM MgCl2, 0.1 mM ATP, 20 nM 10-mer HORNA>p substrate, and 1 µM AtRNL was incubated at 22°C. Aliquots (20 µL) were removed at the times specified and quenched immediately with an equal volume of 90% formamide, 30 mM EDTA. The time 0 sample was withdrawn and quenched prior to adding AtRNL. The products were resolved by urea-PAGE. An autoradiogram of the gel is shown in panel C. The levels of the healed HORNA2′p and pRNA2′p intermediates and the ligated circle product were quantified by scanning the gel with a Fujix BAS2500 imager and are plotted as a function of time in panel B. Each datum is the average of three separate time-course experiments ±SEM. The data were fit by nonlinear regression in Prism to a sequential three-step reaction pathway shown at right in panel B. The apparent rate constants for the CPD, kinase, and ligase reactions are indicated.
FIGURE 2.
FIGURE 2.
Reaction of AtRNL with an 8-mer HORNA>p substrate. (A) Wild-type AtRNL and the indicated mutants were reacted with a 3′ 32P-labeled 8-mer HORNA>p substrate (depicted at the bottom of the panel with the 32P-label denoted by •). Reaction mixtures (20 µL) containing 50 mM Tris-HCl, pH 8.0, 50 mM NaCl, 2 mM DTT, 10 mM MgCl2, 100 µM ATP, 20 nM 8-mer HORNA>p, and 1 µM AtRNL (wild-type or mutant as specified) were incubated for 5 min at 22°C. The reactions were quenched with formamide, EDTA, and the products were analyzed by urea-PAGE. An autoradiograph of the gel is shown. The position and identities of the radiolabeled RNA substrate and the various healed or sealed products are indicated on the left and right. (B,C) Single-turnover kinetics. A reaction mixture (250 µL) containing 50 mM Tris-HCl, pH 8.0, 50 mM NaCl, 2 mM DTT, 10 mM MgCl2, 0.1 mM ATP, 20 nM 8-mer HORNA>p substrate, and 1 µM AtRNL was incubated at 22°C. Aliquots (20 µL) were removed at the times specified and quenched immediately with formamide, EDTA. The time 0 sample was withdrawn and quenched prior to adding AtRNL. The products were resolved by urea-PAGE. An autoradiogram of the gel is shown in panel B. The levels of the healed HORNA2′p and pRNA2′p intermediates and the ligated circle product were quantified by scanning the gel and are plotted as a function of time in panel C. Each datum is the average of three separate time-course experiments ±SEM. The data were fit by nonlinear regression in Prism to a sequential three-step reaction pathway shown at right in panel B. The apparent rate constants for the CPD, kinase, and ligase reactions are indicated.
FIGURE 3.
FIGURE 3.
Reaction of AtRNL with a 6-mer HORNA>p substrate. A reaction mixture (250 µL) containing 50 mM Tris-HCl, pH 8.0, 50 mM NaCl, 2 mM DTT, 10 mM MgCl2, 0.1 mM ATP, 20 nM 6-mer HORNA>p substrate (depicted at the bottom of panel A with the 32P-label denoted by •), and 1 µM AtRNL was incubated at 22°C. Aliquots (20 µL) were removed at the times specified and quenched immediately with formamide, EDTA. The time 0 sample was withdrawn and quenched prior to adding AtRNL. The products were resolved by urea-PAGE. An autoradiogram of the gel is shown in panel A. The levels of the healed HORNA2′p and pRNA2′p intermediates and the ligated dimer product were quantified by scanning the gel and are plotted as a function of time in panel B. Each datum is the average of three separate time-course experiments ±SEM. The data were fit by nonlinear regression in Prism to a sequential three-step reaction pathway shown at right in panel B. The apparent rate constants for the CPD, kinase, and ligase reactions are indicated.
FIGURE 4.
FIGURE 4.
AtRNL efficiently splices a 5′-OH DNA with a ribonucleoside-2′,3′-cyclic-PO4 terminus. A reaction mixture (160 µL) containing 50 mM Tris-HCl, pH 8.0, 50 mM NaCl, 2 mM DTT, 2 mM MnCl2, 100 µM ATP, 1 µM AtRNL, and 20 nM 3′ 32P-labeled 18-mer HOD17Rp substrate (shown with the 3′ ribonucleoside shaded and the 32P-label denoted by •) was incubated at 22°C. Aliquots (20 µL) were withdrawn at the times specified and quenched immediately with an equal volume of 90% formamide, 30 mM EDTA. The time 0 sample was withdrawn and quenched prior to adding AtRNL. The products were analyzed by urea-PAGE. An autoradiograph of the gel is shown in the top panel. The position of the linear substrate (HOD17R>p) is indicated on the left; the positions of the healed intermediate (pD17R2′p) and the ligated circle product are indicated on the right. The kinetic profile of the intramolecular end joining reaction is plotted in the bottom panel. Each datum in the graph is the average of three separate experiments ±SEM. A nonlinear regression curve fit of the data to a single exponential is shown.
FIGURE 5.
FIGURE 5.
NTP donor specificity of the KlaTrl1 5′ kinase reaction. (A) Reaction mixtures (20 µL) containing 50 mM Tris-HCl, pH 8.0, 2 mM DTT, 10 mM MgCl2, 20 nM 3′ 32P-labeled 10-mer HORNA>p substrate (depicted at the bottom of the panel with the 32P-label denoted by •), 1 µM KlaTrl1-(385–813), and either no added NTP (lane –) or 0.1 µM of the indicated NTP were incubated at 22°C for 1 min, then quenched with an equal volume of 90% formamide, 30 mM EDTA. The products were analyzed by urea-PAGE and visualized by autoradiography. Enzyme was omitted from the control reaction in the leftmost lane. (B,C) Reaction mixtures (20 µL) containing 50 mM Tris-HCl (pH 8.0), 2 mM DTT, 10 mM MgCl2, 20 nM HOR10>p, 1 µM KlaTrl1-(385–813), and either 0.1, 1, 10, or 100 µM of the indicated NTP (either ATP, CTP, GTP, or UTP in panel B) or dNTP (dATP, dCTP, dGTP, dTTP, or dUTP in panel C) were incubated at 22°C for 1 min. The products were analyzed by urea-PAGE. The extents of 5′ phosphorylation were quantified by scanning the gel and are plotted in bar graph format as a function of NTP or dNTP concentration. Each datum is the average of three separate experiments ±SEM.
FIGURE 6.
FIGURE 6.
Purine NTP analogs as substrates for the KlaTrl1 kinase reaction. Reaction mixtures (20 µL) containing 50 mM Tris-HCl, pH 8.0, 2 mM DTT, 10 mM MgCl2, 20 nM HOR10>p, 1 µM KlaTrl1-(385–813), and 1, 10, or 100 µM of the indicated purine NTPs were incubated at 22°C for 1 min. The extents of 5′ phosphorylation are plotted in bar graph format as a function of NTP or dNTP concentration. Each datum is the average of three separate experiments ±SEM. The chemical structures of the nucleobases are shown below the graph.
FIGURE 7.
FIGURE 7.
Single-turnover kinetics of the KlaTrl1 kinase reaction. Rapid mix-quench assays of kinase activity under conditions of enzyme excess were performed as described in Materials and Methods, with either 100 µM GTP (panel A) or 100 µM UTP (panel B) as the phosphate donor. The extents of product formation are plotted as a function of reaction time. Each datum in the graphs is the average of three separate time-course experiments ±SEM. Nonlinear regression curve fits of the data to a single exponential are shown; the rate constants are indicated.
FIGURE 8.
FIGURE 8.
Kinetics of healing and sealing a 20-mer HORNA>p substrate by KlaTrl1. A reaction mixture (240 µL) containing 50 mM Tris-HCl, pH 8.0, 2 mM DTT, 10 mM MgCl2, 100 µM ATP, 100 µM GTP, 20 nM 3′ 32P-labeled 20-mer HORNA>p substrate (depicted at the bottom of panel A with the 32P-label denoted by •), and 1 µM KlaTrl1 was incubated at 22°C. Aliquots (20 µL) were withdrawn at the times specified and quenched immediately with an equal volume of 90% formamide, 30 mM EDTA. The time 0 sample was withdrawn and quenched prior to adding KlaTrl1. The products were analyzed by urea-PAGE. An autoradiogram of the gel is shown in panel A. The position and identities of the radiolabeled substrate and products are indicated on the left and right. The extent of ligation ([circle + multimers]/total RNA) is plotted as a function of time in panel B. Each datum is the average of three separate time-course experiments ±SEM. A nonlinear regression curve fit of the data to a single exponential is shown.
FIGURE 9.
FIGURE 9.
Reaction of KlaTrl1 with a 10-mer HORNA>p substrate. A reaction mixture (200 µL) containing 50 mM Tris-HCl, pH 8.0, 2 mM DTT, 10 mM MgCl2, 100 µM ATP, 100 µM GTP, 20 nM 3′ 32P-labeled 10-mer HORNA>p substrate (depicted at the bottom of panel A with the 32P-label denoted by •), and 1 µM KlaTrl1 was incubated at 22°C. Aliquots (20 µL) were withdrawn at the times specified and quenched immediately. The products were analyzed by urea-PAGE. An autoradiogram of the gel is shown in panel A. The position and identities of the radiolabeled substrate and products are indicated on the left and right. The extent of ligation (circle/total RNA) and the extent of RNA adenylylation ([AppRNAp + circle]/total RNA) are plotted as a function of time in panel B. Each datum is the average of three separate time-course experiments ±SEM. Nonlinear regression curve fits of the data to a single exponential are shown.

Similar articles

Cited by

References

    1. Apostol BL, Westaway SK, Abelson J, Greer CL 1991. Deletion analysis of a multifunctional yeast tRNA ligase polypeptide: Identification of essential and dispensable functional domains. J Biol Chem 266: 7445–7455 - PubMed
    1. Chakravarty AK, Subbotin R, Chait BT, Shuman S 2012. RNA ligase RtcB splices 3′-phosphate and 5′-OH ends via covalent RtcB-(histidinyl)-GMP and polynucleotide-(3′)pp(5′)G intermediates. Proc Natl Acad Sci 109: 6072–6077 - PMC - PubMed
    1. Das U, Shuman S 2013. 2′-Phosphate cyclase activity of RtcA: A potential rationale for the operon organization of RtcA with an RNA repair ligase RtcB in Escherichia coli and other bacterial taxa. RNA 19: 1355–1362 - PMC - PubMed
    1. Das U, Chakravarty AK, Remus BS, Shuman S 2013a. Rewriting the rules for end joining via enzymatic splicing of DNA 3′-PO4 and 5′-OH ends. Proc Natl Acad Sci 110: 20437–20442 - PMC - PubMed
    1. Das U, Wang LK, Smith P, Shuman S 2013b. Structural and biochemical analysis of the phosphate donor specificity of the polynucleotide kinase component of the bacterial Pnkp•Hen1 RNA repair system. Biochemistry 52: 4734–4743 - PMC - PubMed

Publication types

MeSH terms