. 2014 Feb 19;4(2):130210.
doi: 10.1098/rsob.130210.

Protein associated with SMAD1 (PAWS1/FAM83G) is a substrate for type I bone morphogenetic protein receptors and modulates bone morphogenetic protein signalling

Affiliations

Protein associated with SMAD1 (PAWS1/FAM83G) is a substrate for type I bone morphogenetic protein receptors and modulates bone morphogenetic protein signalling

Janis Vogt et al. Open Biol. .

Abstract

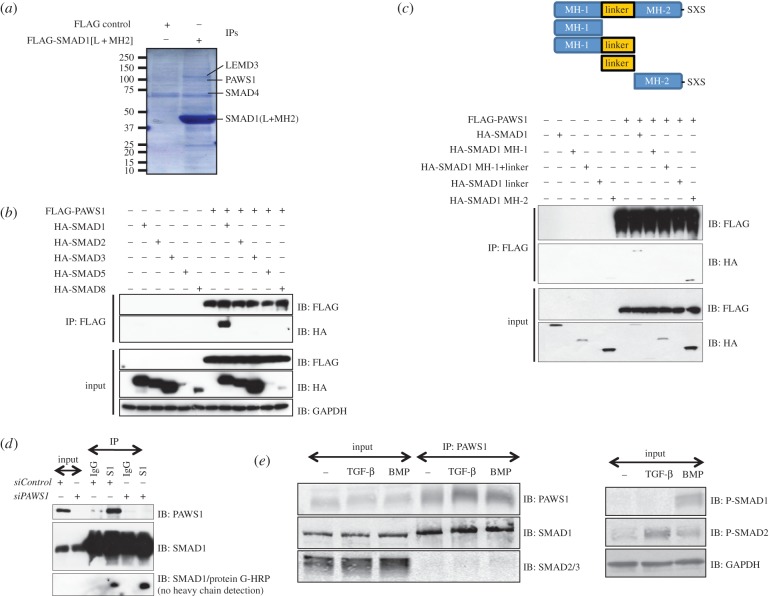
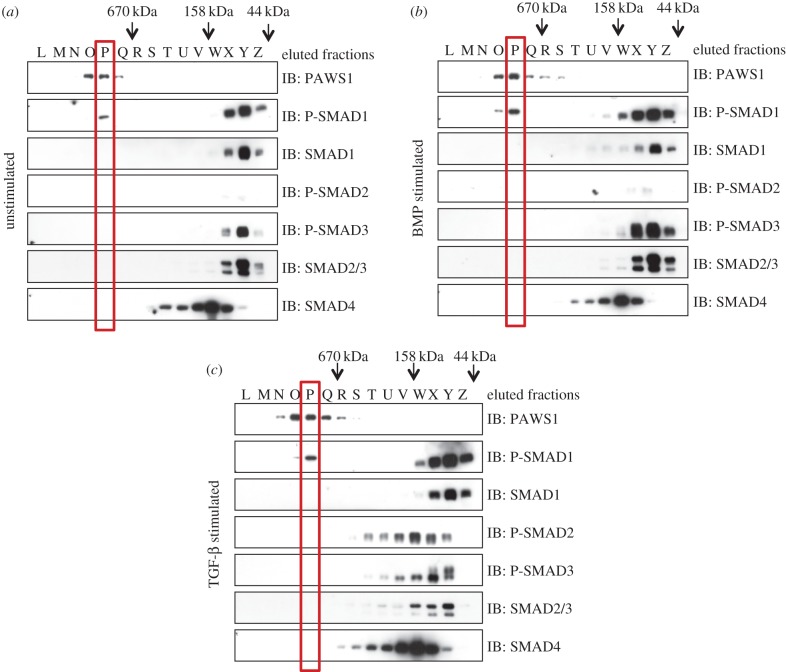
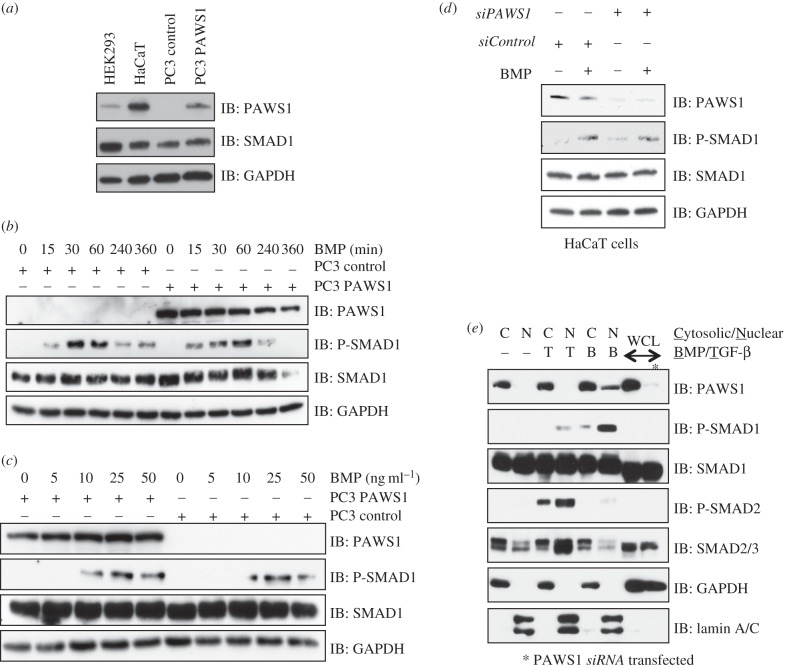
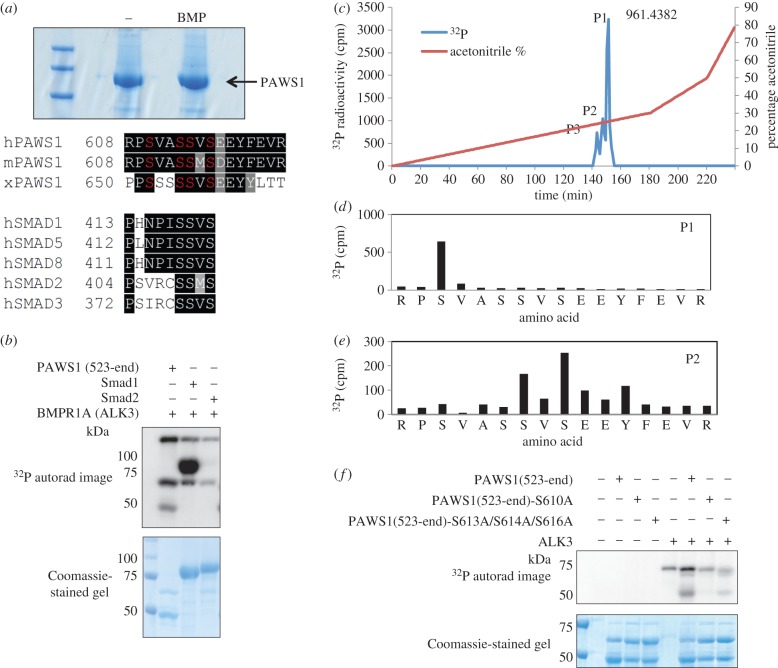
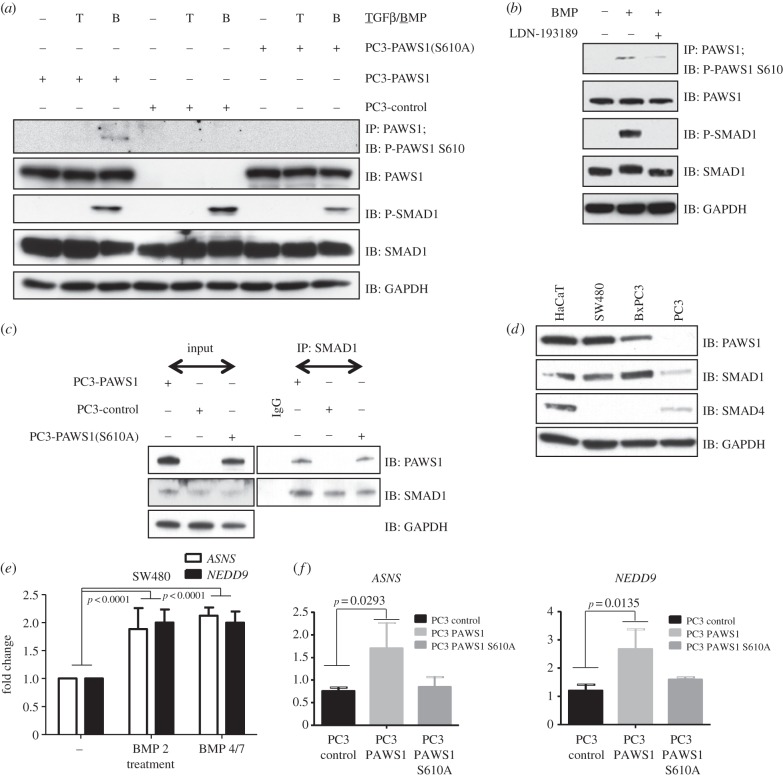
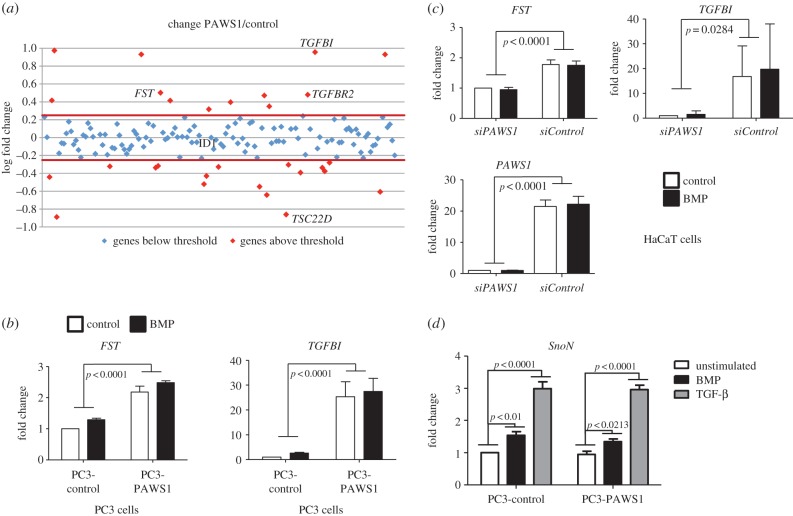
Bone morphogenetic proteins (BMPs) control multiple cellular processes in embryos and adult tissues. BMPs signal through the activation of type I BMP receptor kinases, which then phosphorylate SMADs 1/5/8. In the canonical pathway, this triggers the association of these SMADs with SMAD4 and their translocation to the nucleus, where they regulate gene expression. BMPs can also signal independently of SMAD4, but this pathway is poorly understood. Here, we report the discovery and characterization of PAWS1/FAM83G as a novel SMAD1 interactor. PAWS1 forms a complex with SMAD1 in a SMAD4-independent manner, and BMP signalling induces the phosphorylation of PAWS1 through BMPR1A. The phosphorylation of PAWS1 in response to BMP is essential for activation of the SMAD4-independent BMP target genes NEDD9 and ASNS. Our findings identify PAWS1 as the first non-SMAD substrate for type I BMP receptor kinases and as a novel player in the BMP pathway. We also demonstrate that PAWS1 regulates the expression of several non-BMP target genes, suggesting roles for PAWS1 beyond the BMP pathway.

Keywords: ALK3; BMPR1; FAM83G; PAWS1; SMAD1; bone morphogenetic protein.


Figures

Figure 1.
Figure 1.
PAWS1 interacts with SMAD1. (a) Anti-FLAG IPs from HEK293 extracts transfected with vectors either encoding FLAG control or FLAG-tagged SMAD1[L + MH2] fragment were incubated with HeLa extracts. Elution was performed with 3X FLAG peptide. Eluted proteins were denatured and resolved by SDS–PAGE and the gel was Coomassie-stained. Gel pieces (2 mm) covering the entire lane of each sample were excised for identification by mass fingerprinting. The positions of some of the identified proteins are indicated. (b) HEK293 cells were transfected with the indicated HA-SMAD constructs either alone or together with FLAG-PAWS1 construct. The extracts and anti-FLAG IPs were analysed by immunoblotting using the indicated antibodies. (c) HEK293 cells transfected with constructs encoding either HA-SMAD1 or indicated HA-SMAD1 truncation mutants either individually or together with construct encoding FLAG-PAWS1. The extracts and anti-FLAG IPs were analysed by immunoblotting using the indicated antibodies. (d) HaCaT cells were transfected with a pool of two different siRNAs against either PAWS1 (150 pM each), or with siRNA against FOXO4, for 48 h prior to lysis. Extracts and IPs, using either anti-SMAD1 antibody or pre-immune IgG, were analysed by immunoblotting using the indicated antibodies. For SMAD1/protein-G-HRP immunoblot, the membrane was first blocked in 5% milk containing 500 ng ml−1 protein G, incubated with SMAD1 antibody as primary, and protein-G HRP was used as secondary. This strategy excludes the detection of antibody heavy chains in IP samples. (e) HaCaT cells were treated with either BMP-2 (25 ng ml−1; 1 h), TGF-β (50 pM; 1 h) or left untreated prior to lysis. Extracts and anti-PAWS1 IPs were analysed by immunoblotting with the indicated antibodies.
Figure 2.
Figure 2.
Size-exclusion chromatography. (a) Unstimulated HaCaT cell extracts were fractionated by gel filtration chromatography on a Superose 10/300 GL column (GE Healthcare). Five microlitres of each recovered fraction was resolved by SDS–PAGE and subsequently analysed by immunoblotting using the indicating antibodies. (b) Same as (a) except the cells were treated with BMP-2 (25 ng ml−1) for 1 h prior to lysis. (c) Same as (a) except the cells were treated with TGF-β (50 pM) for 1 h prior to lysis.
Figure 3.
Figure 3.
Effect of PAWS1 on BMP-induced SMAD1 phosphorylation. (a) Extracts (20 μg protein) from either HEK293, HaCaT, PC3-control (PC3 cells stably integrated with a control vector), or PC3-PAWS1 cells (PC3 cells stably integrated with a vector encoding wild-type PAWS1) were resolved by SDS–PAGE and analysed by immunoblotting using the indicated antibodies. (b) PC3-control and PC3-PAWS1 cells were treated with BMP-2 (25 ng ml−1) for the indicated time (min) prior to lysis. Extracts (20 μg protein) were resolved by SDS–PAGE and analysed by immunoblotting using the indicated antibodies. (c) PC3-control and PC3-PAWS1 cells were treated with the indicated concentrations of BMP-2 for 1 h prior to lysis. Extracts (20 μg protein) were resolved by SDS–PAGE and analysed by immunoblotting using the indicated antibodies. (d) PAWS1-depleted HaCaT cells (siPAWS1) and HaCaT cells expressing FOXO4 siRNA (siControl) were treated either with or without BMP-2 (25 ng ml−1) for 1 h prior to lysis. Extracts (20 µg protein) were resolved by SDS–PAGE and immunoblotted with the indicated antibodies. (e) Extracts from HaCaT cells treated with either BMP-2 (25 ng ml−1) or TGF-β (50 pM) for 1 h, or left untreated were separated into cytosolic and nuclear fractions. Fractions and whole cell lysates (WCLs) were resolved by SDS–PAGE and analysed by immunoblotting using the indicated antibodies. GAPDH and lamin A/C were used as cytosolic and nuclear controls, respectively.
Figure 4.
Figure 4.
Phosphorylation of PAWS1 by BMPR1A (ALK3). (a) GFP IPs from HEK293 cells stably expressing GFP-PAWS1 treated either with or without BMP-2 (25 ng ml−1) were resolved by SDS–PAGE. The gel was Coomassie-stained, and bands representing GFP-PAWS1 were excised, digested with trypsin and phosphopeptides identified by mass spectrometry. The sequence alignment of the PAWS1 triphosphopeptide identified upon BMP treatment compared with other vertebrates is shown. Also shown for comparison is the sequence alignment of the SSVS motif in different R-SMADs. h, human; m, mouse; x, Xenopus laevis. (b) Kinase assays were set up with BMPR1A (ALK3) using GST-SMAD1, GST-SMAD2 and GST-PAWS1 (523-end) as substrates using γ32P-ATP as described in the methods. Samples were resolved by SDS–PAGE, the gel was Coomassie-stained and radioactivity was analysed by autoradiography. (c) GST-PAWS1(523-end) phosphorylated by BMPR1A in B was excised, digested with trypsin and resolved by HPLC on a C18 column using an increasing acetonitrile gradient as indicated. Three peaks (P1–3) of 32P radioactivity release were observed. Analysis of peak P1 by LC–MS–MS revealed the phosphopeptide RPSVASSVSEEYFEVR, with an observed m/z of 961.4382[2+]. Similarly, peak P2 revealed the diphosphopeptide RPSVASSVSEEYFEVR, with observed m/z of 1001.42 [2+]. (d) Solid-phase sequencing of peak P1 showed the 32P radioactivity after the third cycle of Edman degradation. (e) Solid-phase sequencing of peak P2 revealed the release of 32P radioactivity after the seventh and ninth cycles of Edman degradation. Amino acid sequences in (d,e) were deduced from LC–MS–MS analysis. (f) As in (b) except that BMPR1A (ALK3) was incubated in a kinase assay with GST-PAWS1(523-end), GST-PAWS1(523-end)S610A or GST-PAWS1(523-end)S613A/S614A/S616A used as substrates.
Figure 5.
Figure 5.
The role of PAWS1 in the BMP pathway. (a) PC3-control, PC3-PAWS1 and PC3-PAWS1(S610A) cells were treated with either BMP-2 (25 ng ml−1), TGF-β (50 pmol) or left untreated for 1 h prior to lysis. PAWS1 was immunoprecipitated from cell extracts (1 mg protein) using anti-PAWS1 antibody. Anti-PAWS1 IPs and extract inputs (20 µg protein) were resolved by SDS–PAGE and immunoblotted with the indicated antibodies. (b) HaCaT cells were either left unstimulated or stimulated with BMP-2 (25 ng ml−1) or BMP-2 and LDN193189 (100 nM) for 1 h prior to lysis. PAWS1 was immunoprecipitated from cell extracts (1 mg protein) using anti-PAWS1 antibody. Anti-PAWS1 IPs and extract inputs (20 µg protein) were resolved by SDS–PAGE and immunoblotted with the indicated antibodies. (c) PC3-control, PC3-PAWS1 and PC3-PAWS1(S610A) cells were lysed and SMAD1 immunoprecipitated from extracts (1 mg protein) using anti-SMAD1 antibody. IP using pre-immune IgG was used as control from PC3-PAWS1 cell extracts (1 mg protein). SMAD1 IPs, IgG IP and extract inputs (20 µg protein) were resolved by SDS–PAGE and immunoblotted with the indicated antibodies. (d) Extract inputs (20 μg protein) from HaCaT, SW480, BxPC3 and PC3 cells were resolved by SDS–PAGE and analysed by immunoblotting using the indicated antibodies. (e) SW480 cells were either treated with BMP-2 (25 ng ml−1) and BMP-2/7 (10 ng ml−1 each) or left untreated for 6 h prior to RNA isolation. The relative expression of the indicated genes was analysed by qRT-PCR as described in the methods. The results show the fold change in gene expression relative to unstimulated controls. Data are represented as mean of three biological replicates and error bars indicate standard deviation (n = 3). (f) PC3-control, PC3-PAWS1 and PC3-PAWS1(S610A) cells were either treated with BMP-2 (25 ng ml−1) or left untreated for 6 h prior to RNA isolation. The relative expression of the indicated genes was analysed by qRT-PCR as described in §5. The results show the fold change in gene expression relative to unstimulated controls. Data are represented as mean of three biological replicates and error bars indicate standard deviation (n = 3).
Figure 6.
Figure 6.
PAWS1 impacts the expression of multiple genes in the TGF/BMP pathways independent of BMP treatment. (a) Scatter plots of log fold change in expression in PC3-PAWS1 over PC3-control cells of 150 TGF-β/BMP pathway components and target genes analysed by qPCR macroarray. Each dot represents the expression of a single gene. (b) PC3-PAWS1 and PC3-control cells were treated either with or without BMP-2 (25 ng ml−1) for 6 h prior to lysis and the expression of FST and TGFBI was analysed by qRT-PCR as described in the methods. The results show the fold change in gene expression relative to the levels observed for unstimulated PC3-control cells. Data are represented as mean of three biological repeats and error bars indicate standard deviation (n = 3). (c) PAWS1-depleted HaCaT cells (siPAWS1) or HaCaT cells expressing FOXO4 siRNA (siControl) were treated with or without BMP-2 (25 ng ml−1) for 6 h prior to lysis and the expression of FST, TGFBI and PAWS1 was analysed by qRT-PCR. The results show the fold change in gene expression relative to the levels observed for unstimulated siPAWS1 HaCaT cells. Data are represented as mean of three biological repeats and error bars indicate standard deviation (n = 3). (d). PC3-control and PC3-PAWS1 cells were treated with control, BMP-2 (25 ng ml−1) or TGFβ (50 pM) for 6 h prior to lysis, and the expression of SnoN was analysed by qRT-PCR. The results show the fold change in SnoN expression relative to the levels observed for control-stimulated PC3-control cells. Data are represented as mean of three biological repeats and error bars indicate standard deviation (n = 3).

References

    1. Chen D, Zhao M, Mundy GR. 2004. Bone morphogenetic proteins. Growth Factors 22, 233–241. (doi:10.1080/08977190412331279890) - DOI - PubMed
    1. De Robertis EM, Kuroda H. 2004. Dorsal–ventral patterning and neural induction in Xenopus embryos. Annu. Rev. Cell Dev. Biol. 20, 285–308. (doi:10.1146/annurev.cellbio.20.011403.154124) - DOI - PMC - PubMed
    1. Harland R. 2000. Neural induction. Curr. Opin. Genet. Dev. 10, 357–362. (doi:10.1016/S0959-437X(00)00096-4) - DOI - PubMed
    1. Schier AF, Talbot WS. 2005. Molecular genetics of axis formation in zebrafish. Annu. Rev. Genet. 39, 561–613. (doi:10.1146/annurev.genet.37.110801.143752) - DOI - PubMed
    1. Varga AC, Wrana JL. 2005. The disparate role of BMP in stem cell biology. Oncogene 24, 5713–5721. (doi:10.1038/sj.onc.1208919) - DOI - PubMed

Publication types

MeSH terms

Substances