. 2014 Mar 28;289(13):9182-94.
doi: 10.1074/jbc.M113.513184. Epub 2014 Feb 19.

Calcium co-regulates oxidative metabolism and ATP synthase-dependent respiration in pancreatic beta cells

Affiliations

Calcium co-regulates oxidative metabolism and ATP synthase-dependent respiration in pancreatic beta cells

Umberto De Marchi et al. J Biol Chem. .

Abstract

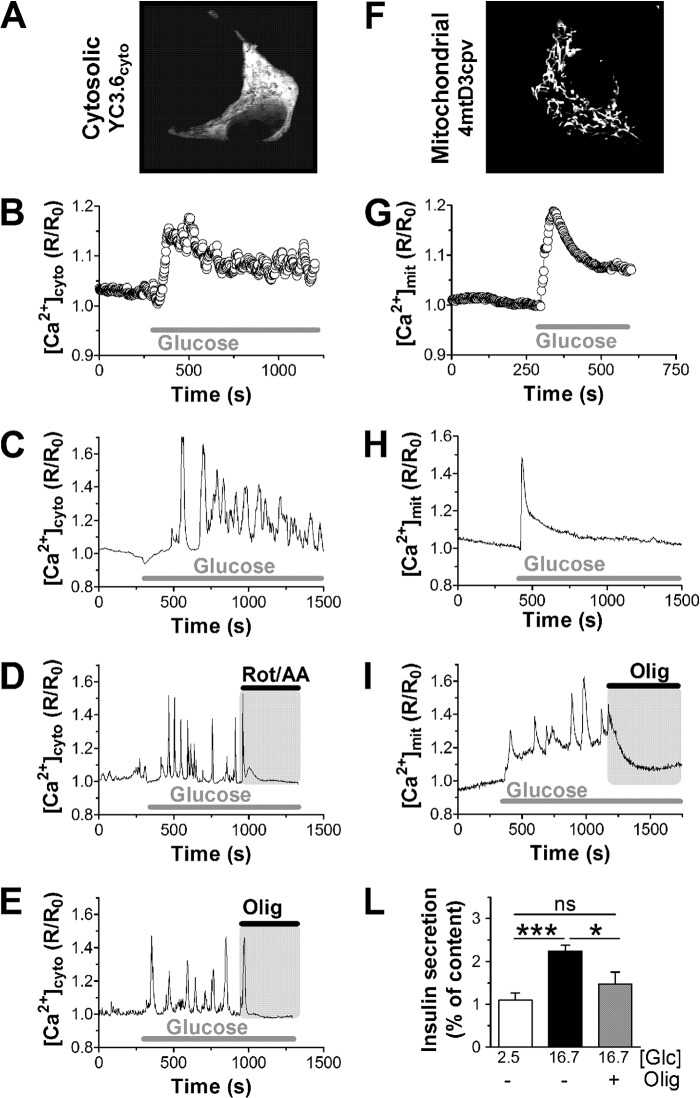
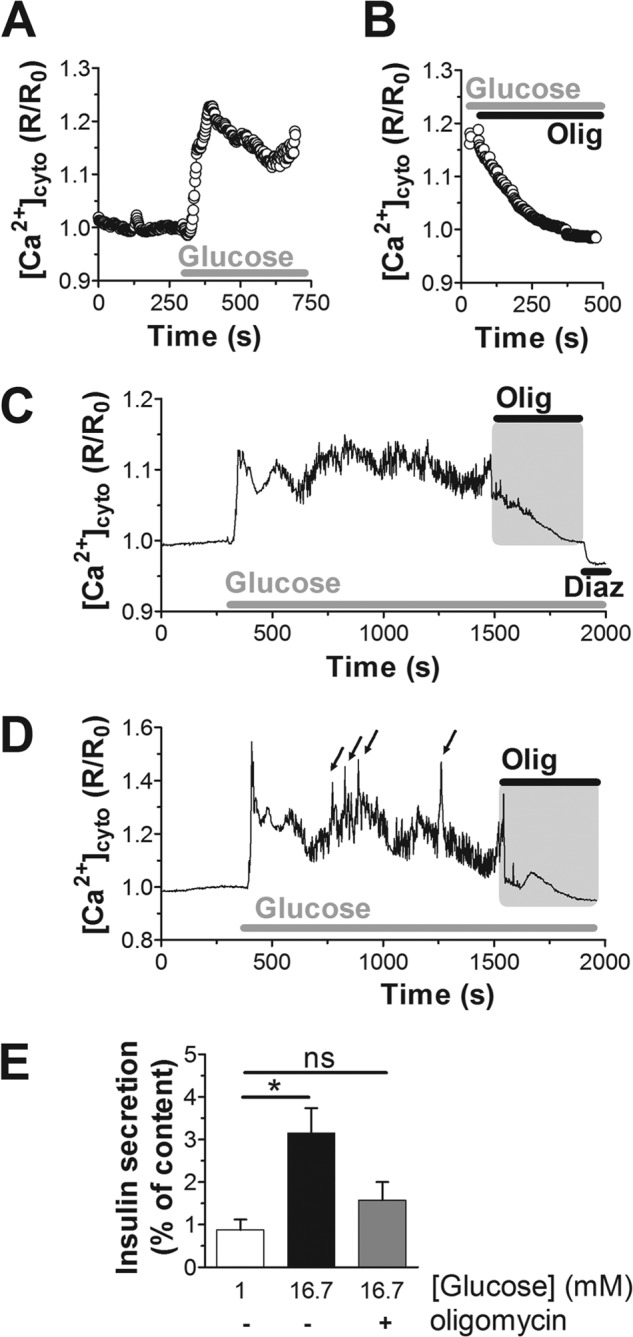
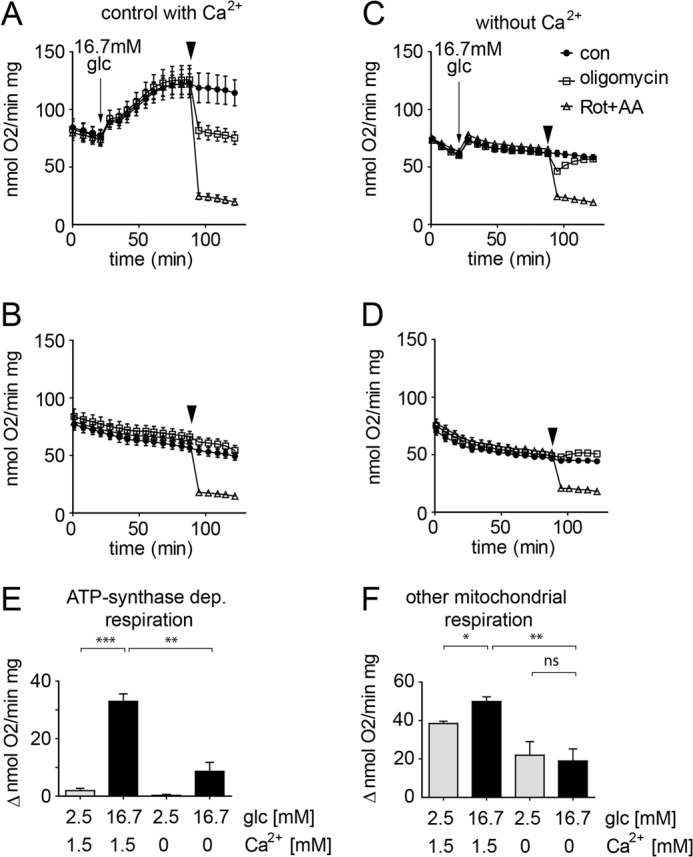
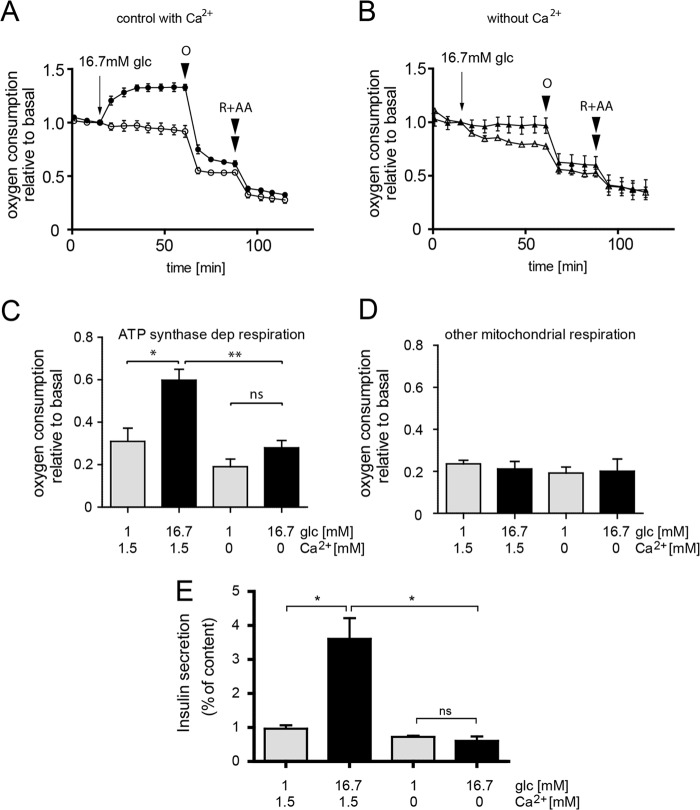
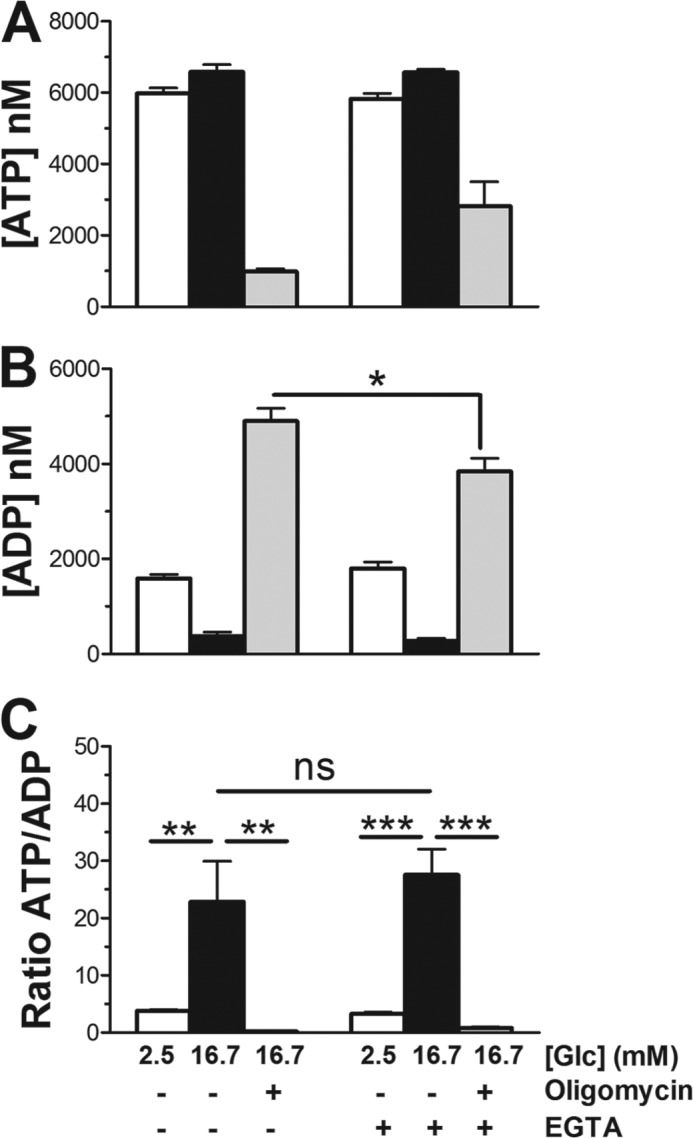
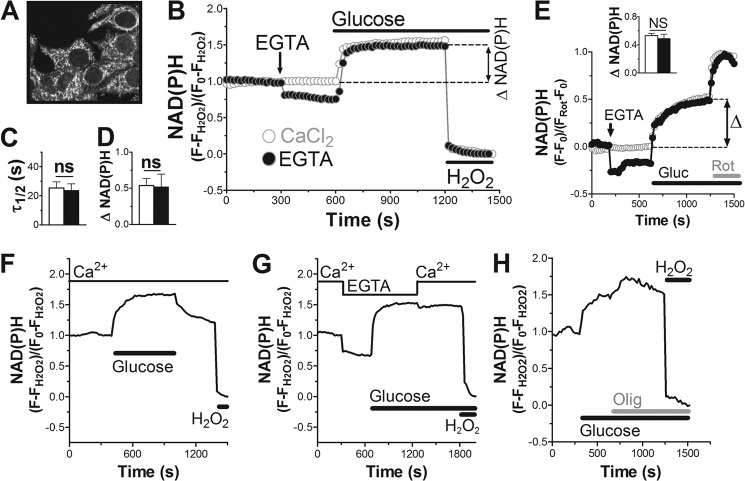
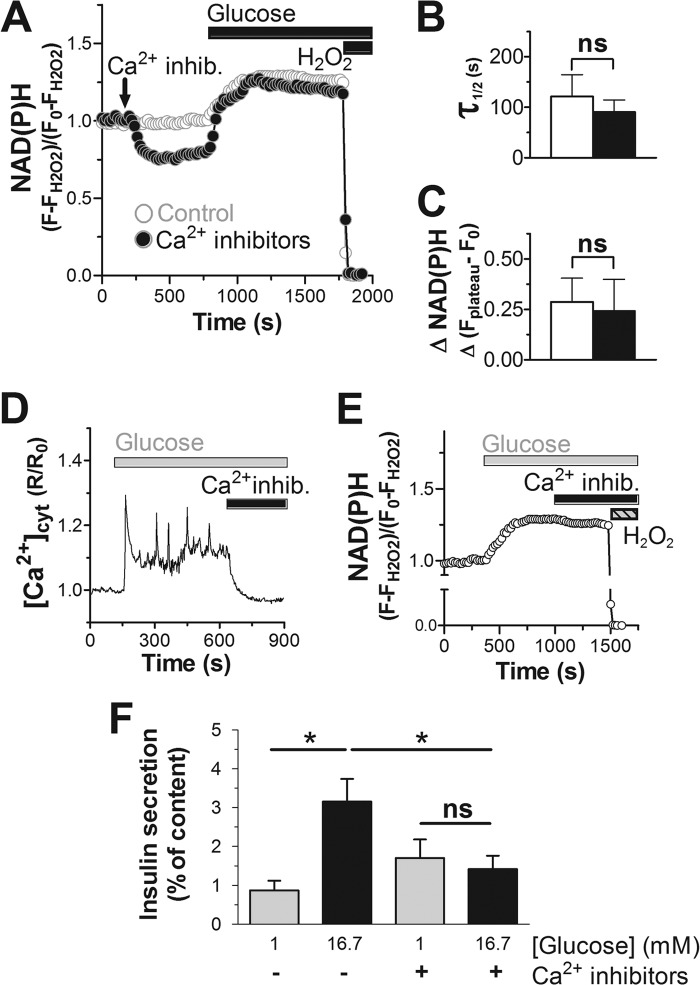
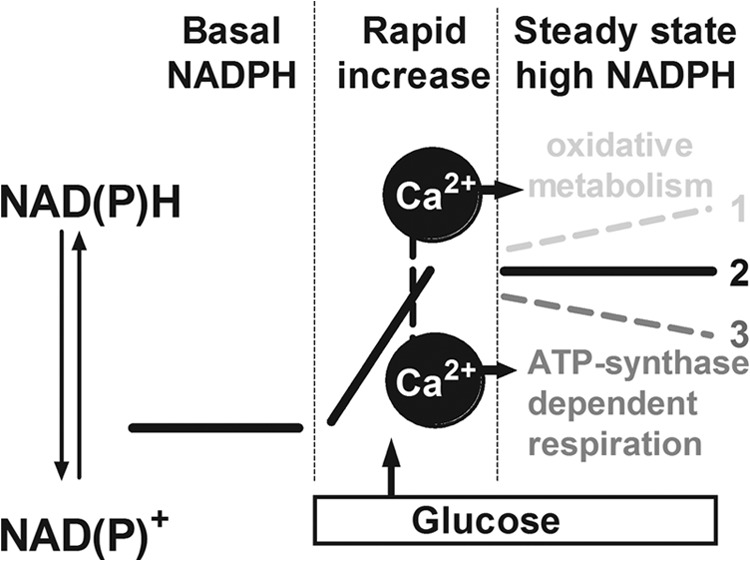
Mitochondrial energy metabolism is essential for glucose-induced calcium signaling and, therefore, insulin granule exocytosis in pancreatic beta cells. Calcium signals are sensed by mitochondria acting in concert with mitochondrial substrates for the full activation of the organelle. Here we have studied glucose-induced calcium signaling and energy metabolism in INS-1E insulinoma cells and human islet beta cells. In insulin secreting cells a surprisingly large fraction of total respiration under resting conditions is ATP synthase-independent. We observe that ATP synthase-dependent respiration is markedly increased after glucose stimulation. Glucose also causes a very rapid elevation of oxidative metabolism as was followed by NAD(P)H autofluorescence. However, neither the rate of the glucose-induced increase nor the new steady-state NAD(P)H levels are significantly affected by calcium. Our findings challenge the current view, which has focused mainly on calcium-sensitive dehydrogenases as the target for the activation of mitochondrial energy metabolism. We propose a model of tight calcium-dependent regulation of oxidative metabolism and ATP synthase-dependent respiration in beta cell mitochondria. Coordinated activation of matrix dehydrogenases and respiratory chain activity by calcium allows the respiratory rate to change severalfold with only small or no alterations of the NAD(P)H/NAD(P)(+) ratio.

Keywords: Calcium; Energy Metabolism; Insulin; Islet; Mitochondria; NAD.


Figures

FIGURE 1.
FIGURE 1.
Inhibition of mitochondrial ATP synthesis rapidly ends glucose-induced cytosolic and mitochondrial calcium signals. Calcium signals were measured in INS-1E cells expressing the cytosolic Ca2+ probe YC3.6 (A–E) or the mitochondria-targeted Ca2+ sensor 4mtD3cpv (F–I). A and E, localization of the Ca2+ probe YC3.6 (Cytosolic; A) and 4mtD3cpv (Mitochondrial; F) recorded at 535 nm. The ratiometric signals were normalized to basal (set to 1). INS-1E cells were stimulated with 16.7 mm glucose as indicated. Average cytosolic (B; 116 cells, n = 11) and mitochondrial (G; 61 cells, n = 10) Ca2+ responses to glucose are presented. Examples of cytosolic (C–E) and mitochondrial (H and I) Ca2+ responses in individual INS-1E cells are also shown. D, respiration was blocked using rotenone (Rot; 1 μm) in combination with antimycin A (AA; 1 μg/ml). E and I, ATP synthase was inhibited with oligomycin (Olig; 2.5 μg/ml). Data are representative of 116 cells (n = 11) (C), 34 cells (n = 4) (D), and 27 cells (n = 3) (E). Mitochondrial traces (H and I) are representative of 61 cells (n = 10) and 24 cells (n = 4), respectively. L, static insulin secretion from INS-1E incubated for 30 min in the presence of resting (white bar) and stimulatory (black and gray bar) glucose (Glc) concentrations as indicated (in mm). Oligomycin (2.5 μg/ml) caused a reduction of glucose-stimulated insulin secretion (gray bar). Shown is the average ±S.E. from 6 measurements (n = 2) *, p < 0.05; ***, p < 0.0001; ns, not significant.
FIGURE 2.
FIGURE 2.
Inhibition of ATP synthase terminates cytosolic calcium signals in human islet beta cells. A–D, cytosolic Ca2+ responses were measured specifically in islet beta cells expressing YC3.6 under the control of the rat insulin promoter. The average Ca2+ response to 16.7 mm glucose (A; 40 cells, n = 5) and inhibition by oligomycin (B; Olig; 2.5 μg/ml; 40 cells, n = 5) are shown. The human islets analyzed were from two donors. C and D, Ca2+ measurements on individual beta cells in the context of the intact islet. Arrows indicate Ca2+ spikes superimposed on top of the net Ca2+ increase. Diazoxide (Diaz) was added at a final concentration of 100 μm. E, static insulin secretion from human islets (1 donor; n = 4). Islets were incubated in 1 mm glucose (white bar) or stimulated with 16.7 mm glucose (black bar). Oligomycin (2.5 μg/ml) prevented glucose-stimulated insulin secretion (gray bar). The difference between glucose stimulation with or without oligomycin did not reach significance (p = 0.07); *, p < 0.01; ns, not significant.
FIGURE 3.
FIGURE 3.
Glucose- and calcium-induced activation of ATP synthase-dependent respiration in INS-1E cells. INS-1E cells were assayed in standard KRBH containing 1.5 mm Ca2+ (A and B) or a KRBH lacking Ca2+ but including 0.4 mm EGTA (Ca2+-free; C and D). The cells were stimulated by adding glucose to a final concentration of 16.7 mm (A and C, arrow) or maintained continuously under basal conditions 2.5 mm glucose (B and D). Inhibitors of the respiratory chain were added as indicated (arrowhead). For each dataset the following conditions were tested: rotenone (Rot; 1 μm) plus antimycin A (AA; 1 μg/ml) (open triangles), oligomycin (2.5 μg/ml; open squares), control (con, DMSO; closed circles). Quantification of ATP synthase-dependent (E) and ATP synthase-independent (F) respiration (see “Experimental Procedures”). A–D, representative results are shown (n = 6, mean ± S.E.). E and F, quantification of the respiration data (average ± S.E.) under control conditions (n = 6) and Ca2+-free conditions (n = 4). Glc, glucose. *, p < 0.01; **, p < 0.001; ***, p < 0.0001; ns, not significant.
FIGURE 4.
FIGURE 4.
Glucose- and calcium-mediated activation of ATP synthase-dependent respiration in human islets. Human islets bound to 804G matrix were incubated in KRBH (A) or a KRBH buffer lacking Ca2+ supplemented with 0.4 mm EGTA (B; Ca2+-free). For each condition the mean ± S.E. n = 3 from the same donor is shown. Total islet protein varied between wells (4–6 μg). Because of these variations the results are expressed relative to the respiratory rate before glucose stimulation. ATP synthase-dependent (dep, C) and -independent respiration (D) was quantified as described under “Experimental Procedures.” The results are the mean ± S.E. (n = 6) obtained from 2 donors. *, p < 0.01; **, p < 0.001; ns, not significant. R, rotenone (1 μm); AA, antimycin A (1 μg/ml); O, oligomycin (2.5 μg/ml); glc, glucose. E, preventing calcium signaling blocks glucose-induced insulin secretion. Insulin secretion from human islets was determined in KRBH or the same buffer lacking Ca2+ in either 1 mm (gray bars) or 16.7 mm glucose (black bars). Shown is the average ±S.E. n = 4 result with islets from a single donor (*, p < 0.05).
FIGURE 5.
FIGURE 5.
Glucose and calcium dependent ATP and ADP responses in INS-1E cells. INS-1E cells were incubated for 30 min in standard KRBH containing 1.5 mm Ca2+ or a KRBH lacking Ca2+ but including 0.4 mm EGTA at either resting (2.5 mm, white bars) or stimulatory (16.7 mm, black bars) glucose (Glc) concentrations. Where indicated, oligomycin (2.5 μg/ml, gray bars) was added during the last 10 min of the 16.7 mm glucose incubation. Glucose-, Ca2+-, and oligomycin-dependent changes are shown separately for ATP (A) and ADP (B) as well as the ATP/ADP ratio (C). Shown is the average n = 8 ±S.E.; n = 2. *, p < 0.01; **, p < 0.001; ***, p < 0.0001; ns, not significant.
FIGURE 6.
FIGURE 6.
Effect of calcium signaling on NAD(P)H responses in INS-1E cells. A, NAD(P)H autofluorescence in INS-1E cells at 2.5 mm glucose. B, E, F, G, and H, kinetics of NAD(P)H fluorescence changes were followed. B, the NAD(P)H signal was normalized to the fluorescence measured at basal glucose (set to 1) minus the minimal signal after full oxidation to NAD(P)+ using excess H2O2 (set to 0). Glucose concentrations were raised from 2.5 to 16.7 mm as indicated. EGTA: Ca2+-free conditions (KRBH without Ca2+ plus 0.4 mm EGTA). C, calculated half-time to reach a new steady state of the NAD(P)H signal after glucose stimulation. D, net glucose-induced increase of the NAD(P)H signal over basal. Shown is the mean ± S.E. (n = 5) for control (white) and Ca2+-free conditions (black). E, glucose (Gluc)-induced NAD(P)H changes using an alternative calibration method. The responses are defined as increase over basal (set to 0) as a fraction of the maximal NAD(P)H signal obtained after inhibition of complex I with rotenone (Rot; 1 μm; set to 1). Shown is the average ±S.E. (n = 3) for control (white) and Ca2+-free conditions (black). Inset, quantification of the NAD(P)H response. F–H, individual measurements of INS-1E cells stimulated with glucose in the presence (F and H) or absence of Ca2+ (G). Effect of nutrient removal (F), calcium re-addition (G), inhibition of respiration with oligomycin (Olig; 2.5 μg/ml; H) are shown. Data are representative of n = 6 (F), n = 3 (G), and n = 5 (H) experiments. ns, not significant.
FIGURE 7.
FIGURE 7.
Effect of calcium signaling on NAD(P)H response and insulin secretion in human islets. A, B, C, and E, the NAD(P)H signal in human islets was followed and quantified as described in Fig. 6. Where indicated the three voltage-dependent Ca2+ channel blockers: isradipine (20 μm), ω-agatoxin (400 nm), and NNC 55-0396 2 μm were added (Ca2+ inhib.). Glucose stimulation in control KRBH (white) or preincubated in the presence of Ca2+ channel blockers (black). A, average glucose responses. B, quantification of the half-time for the NAD(P)H signals to reach a new steady state. C, net glucose-induced increase of the NAD(P)H autofluorescence. For both conditions the average response from human islets (n = 4) originating from 2 donors (n = 2) were analyzed. Shown is the mean ± S.E. D, cytosolic Ca2+ signals were measured after infection of beta cells with an adenovirus carrying YC3.6 as described in the legend to Fig. 2. Human islet cells were stimulated with glucose (16.7 mm). The three Ca2+ channel blockers (Ca2+ inhib.) were added as indicated. Data are representative of 25 cells (n = 4). E, the three Ca2+ channel blockers were added once glucose had raised the NAD(P)H signal to an elevated steady-state level. F, static insulin secretion from human islets as described under “Experimental Procedures.” Secretion was measured in resting (1 mm; gray bars) or stimulatory (16.7 mm; black bars) glucose concentrations. Where indicated the three voltage-dependent Ca2+ channel blockers were included at the concentrations given above. *, p < 0.01; ns, not significant.
FIGURE 8.
FIGURE 8.
Proposed model for the coordinated regulation of oxidative metabolism and ATP synthase dependent respiration by Ca2+ in pancreatic beta cells. After glucose stimulation NAD(P)H levels rapidly increase (1). Continued selective activation of oxidative metabolism would further increase the NAD(P)H/NAD(P)+ ratio (3). Activation of ATP synthase-dependent respiration without stimulation of oxidative metabolism should lower the NAD(P)H levels (2). Mitochondrial Ca2+ signals cause a coordinated activation of oxidative metabolism and ATP synthase-dependent respiration. Rapid establishment of a new NAD(P)H steady state despite continued Ca2+-dependent activation of mitochondrial respiration/energy metabolism (experimentally observed in this study) is shown.

Similar articles

Cited by

References

    1. Balaban R. S., Kantor H. L., Katz L. A., Briggs R. W. (1986) Relation between work and phosphate metabolite in the in vivo paced mammalian heart. Science 232, 1121–1123 - PubMed
    1. Lin A. L., Fox P. T., Hardies J., Duong T. Q., Gao J. H. (2010) Nonlinear coupling between cerebral blood flow, oxygen consumption, and ATP production in human visual cortex. Proc. Natl. Acad. Sci. U.S.A. 107, 8446–8451 - PMC - PubMed
    1. Hellman B., Idahl L. A., Lernmark A., Sehlin J., Täljedal I. B. (1974) The pancreatic beta cell recognition of insulin secretagogues. Effects of calcium and sodium on glucose metabolism and insulin release. Biochem. J. 138, 33–45 - PMC - PubMed
    1. Sweet I. R., Cook D. L., DeJulio E., Wallen A. R., Khalil G., Callis J., Reems J. (2004) Regulation of ATP/ADP in pancreatic islets. Diabetes 53, 401–409 - PubMed
    1. Wiederkehr A., Szanda G., Akhmedov D., Mataki C., Heizmann C. W., Schoonjans K., Pozzan T., Spät A., Wollheim C. B. (2011) Mitochondrial matrix calcium is an activating signal for hormone secretion. Cell Metab. 13, 601–611 - PubMed

MeSH terms

LinkOut - more resources