. 2014 Apr;25(8):1298-311.
doi: 10.1091/mbc.E13-11-0687. Epub 2014 Feb 19.

Caenorhabditis elegans oocyte meiotic spindle pole assembly requires microtubule severing and the calponin homology domain protein ASPM-1

Affiliations

Caenorhabditis elegans oocyte meiotic spindle pole assembly requires microtubule severing and the calponin homology domain protein ASPM-1

Amy A Connolly et al. Mol Biol Cell. 2014 Apr.

Abstract

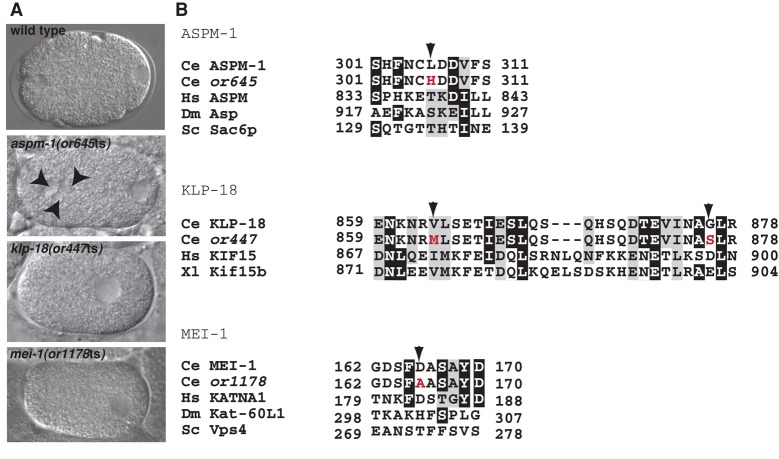
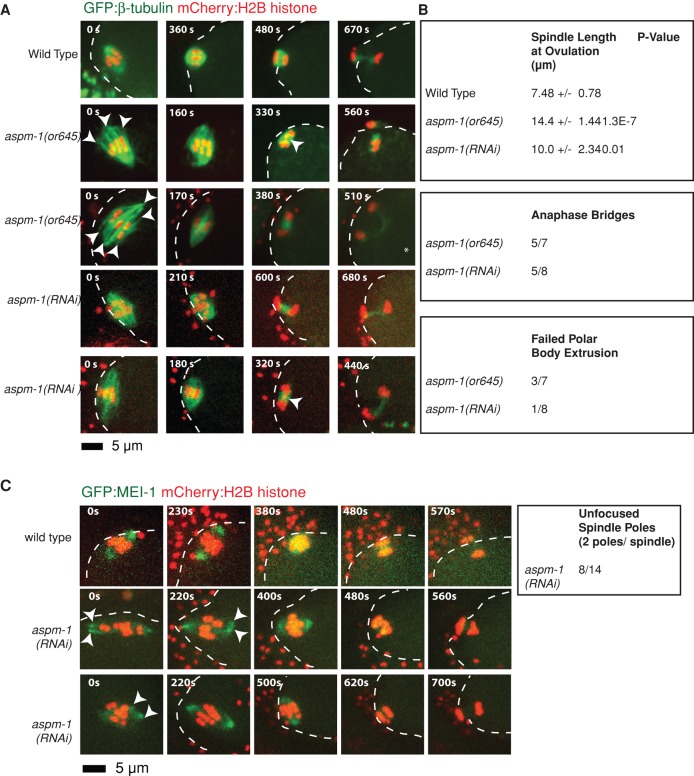
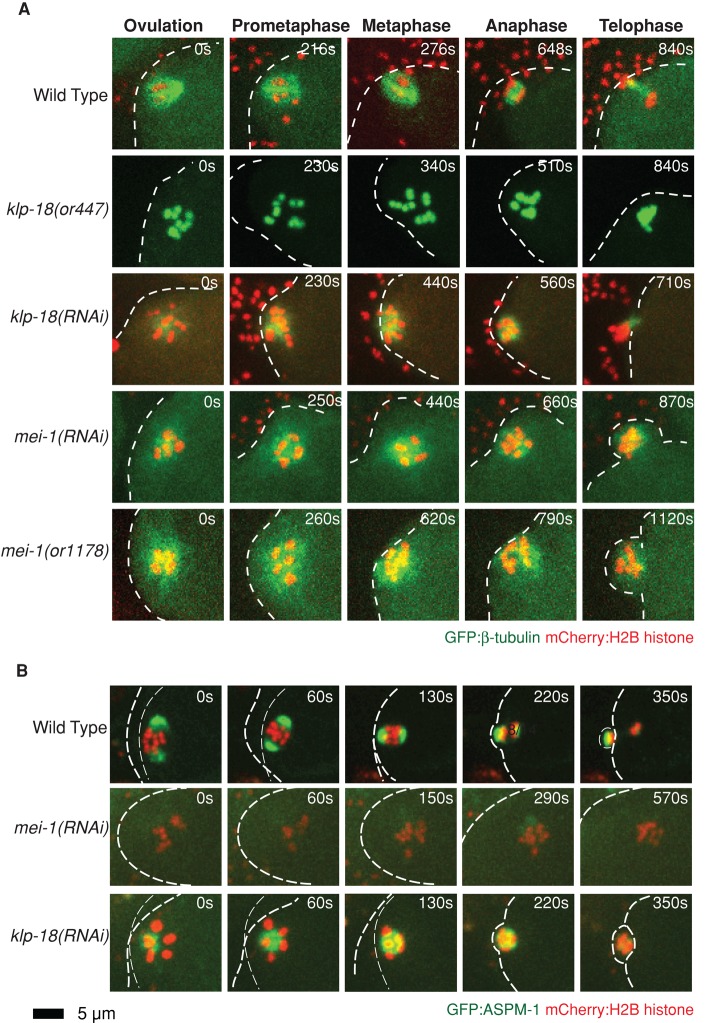
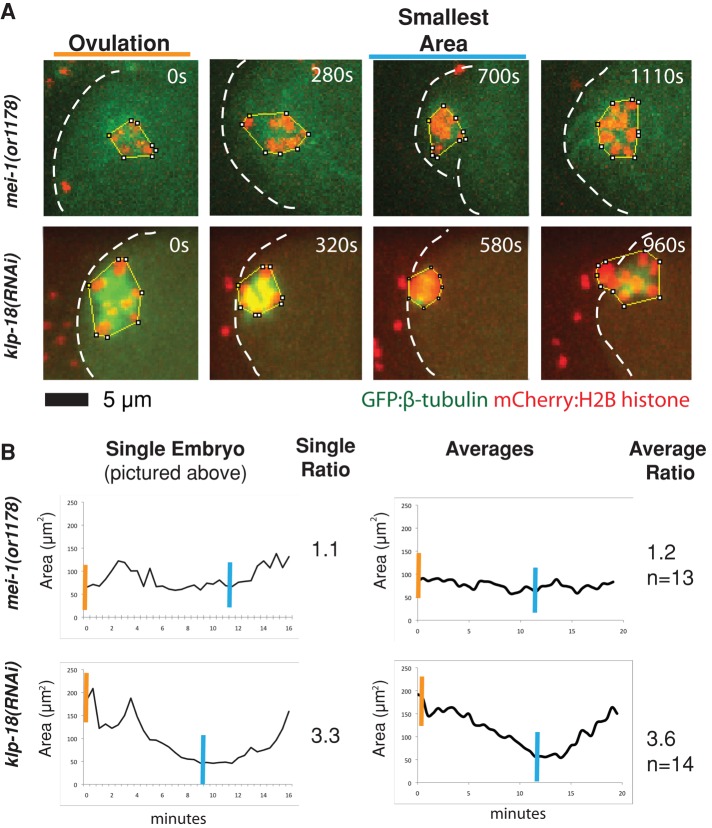
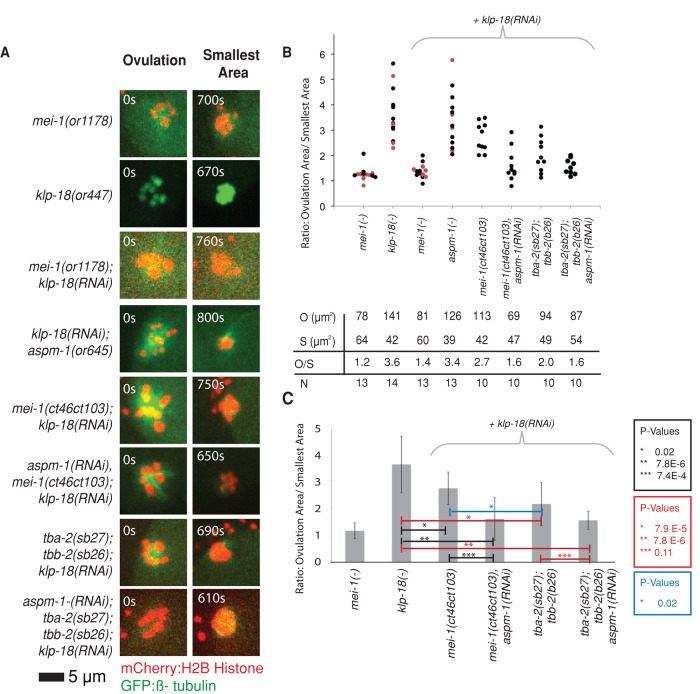
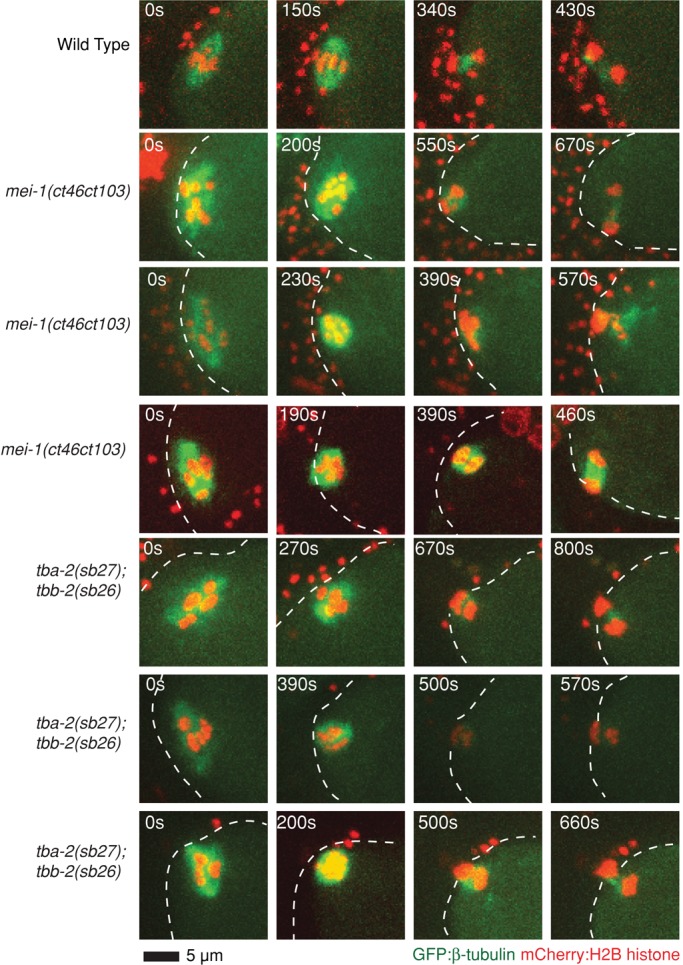
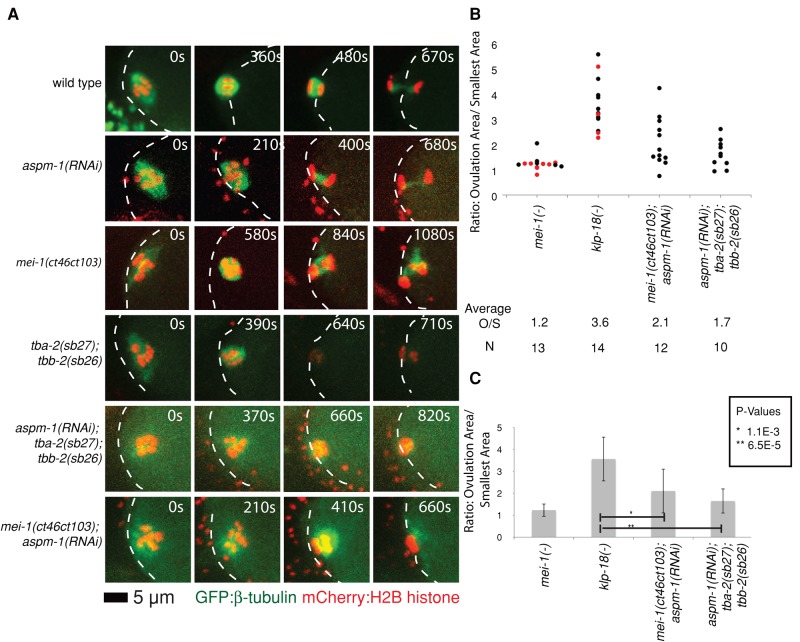
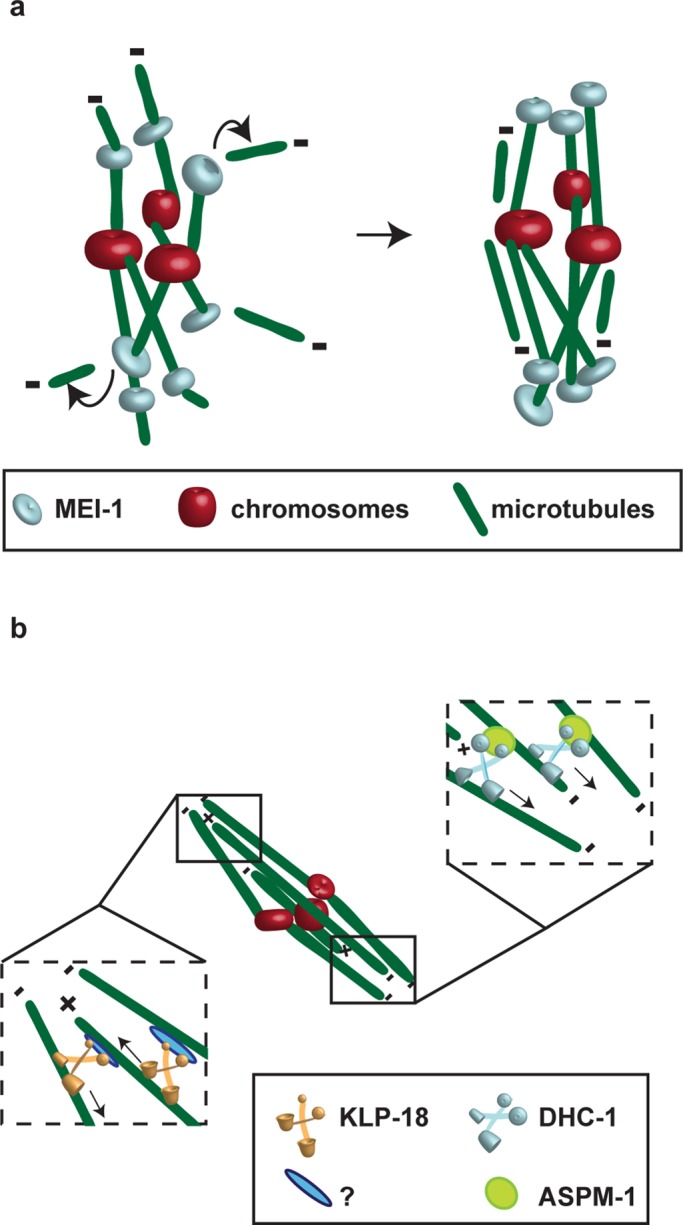
In many animals, including vertebrates, oocyte meiotic spindles are bipolar but assemble in the absence of centrosomes. Although meiotic spindle positioning in oocytes has been investigated extensively, much less is known about their assembly. In Caenorhabditis elegans, three genes previously shown to contribute to oocyte meiotic spindle assembly are the calponin homology domain protein encoded by aspm-1, the katanin family member mei-1, and the kinesin-12 family member klp-18. We isolated temperature-sensitive alleles of all three and investigated their requirements using live-cell imaging to reveal previously undocumented requirements for aspm-1 and mei-1. Our results indicate that bipolar but abnormal oocyte meiotic spindles assemble in aspm-1(-) embryos, whereas klp-18(-) and mei-1(-) mutants assemble monopolar and apolar spindles, respectively. Furthermore, two MEI-1 functions--ASPM-1 recruitment to the spindle and microtubule severing--both contribute to monopolar spindle assembly in klp-18(-) mutants. We conclude that microtubule severing and ASPM-1 both promote meiotic spindle pole assembly in C. elegans oocytes, whereas the kinesin 12 family member KLP-18 promotes spindle bipolarity.


Figures

FIGURE 1:
FIGURE 1:
The ts mutant alleles of aspm-1, klp-18, and mei-1 have abnormal numbers of maternal pronuclei and encode missense mutations. (A) Nomarski images of one-cell-stage wild-type and mutant embryos. Embryos are positioned with the anterior (maternal) and posterior (paternal) pronuclei to the left and right, respectively; genotypes are indicated. Note the presence of extra maternal pronuclei in aspm-1(or645ts) mutant embryos (arrowheads) and the absence of maternal pronuclei in klp-18(or447ts) and mei-1(or1178ts) mutants. (B) Partial sequence alignments of orthologues from C. elegans, Homo sapiens (Hs), Xenopus laevis (Xl), Drosophila melanogaster (Dm), and Saccharomyces cerevisiae (Sc) with the wild-type and mutant C. elegans (Ce) proteins. Arrowheads indicate altered residues, with wild-type amino acids in black and mutant amino acids in red. Note the two mutations in klp-18. The alignment was performed using Boxshade. If the residue is identical to the column consensus, there is a black background; if the residue is similar to the column consensus, there is a gray background.
FIGURE 2:
FIGURE 2:
aspm-1(-) mutants assemble long, bipolar oocyte meiotic spindles with unfocused pole ends and aberrantly organized chromosomes. (A) Spinning-disk confocal images were recorded over time during meiosis I in live wild-type (Supplemental Movie S1) and aspm-1(-) mutant (Supplemental Movies S2 and S3) embryos expressing mCherry:Histone2B and GFP:β-tubulin translational fusions to mark chromosomes and microtubules, respectively. Indicated time points begin at ovulation. A white dashed line marks the edge of the plasma membrane. In the first column, white arrowheads mark unfocused pole ends, and in the third column, arrowheads mark the lagging chromosomes during anaphase, as quantified in B. The asterisk indicates an embryo in which polar body extrusion failed. Bottom rows, examples of mutant embryos with more-focused poles. (B) Quantification of spindle defects in aspm-1(-) mutants. Meiotic spindles were measured directly after ovulation from one end of the pole to the other using spinning-disk confocal images. (C) MEI-1 marks unfocused pole ends in aspm-1(RNAi). Spinning-disk confocal images taken over time during meiosis I in live wild-type (Supplemental Movie S4) and aspm-1(-) mutant (Supplemental Movie S5) embryos expressing GFP:MEI-1 and mCherry:Histone2B translational fusions to mark spindle poles and chromosomes, respectively. Times indicated begin at ovulation. Scale bar as shown. Arrowheads indicate mutant spindle poles that initially appear fragmented but later coalesce into more-focused poles resembling those observed in wild-type embryos.
FIGURE 3:
FIGURE 3:
Monopolar and apolar oocyte meiotic spindles assemble in klp-18(-) and mei-1(-) mutants, respectively. (A) Time-lapse spinning-disk confocal images from immobilized worms were recorded during meiosis I in wild-type (Supplemental Movie S1) and mutant zygotes (Supplemental Movies S6–S9) expressing mCherry:Histone2B and GFP:β-tubulin to mark chromosomes and microtubules, respectively, from ovulation to polar body extrusion, but only GFP:Histone2B marks the chromosomes in klp-18(or447) oocytes. Anterior is to the left, times indicated are relative to ovulation, and a white dashed line marks the edge of the zygote plasma membrane. In this and subsequent figures, each image shown is a projection of six consecutive frames taken at 1.5-μm intervals in a Z-stack for each time point. (B) ASPM-1 marks a single pole in klp-18(-) mutants and no pole in mei-1(-) mutants. Spinning-disk confocal images taken over time during meiosis I in live wild-type (Supplemental Movie S10) and mutant embryos (Supplemental Movies S11 and S12) expressing GFP:ASPM-1 and mCherry:Histone2B translational fusions to mark spindle poles and chromosomes, respectively. Times indicated begin at ovulation. Scale bar as shown.
FIGURE 4:
FIGURE 4:
Measuring the area occupied by chromosomes over time quantitatively distinguishes oocyte meiotic spindle-defective mutant phenotypes. (A) Spinning-disk confocal images were recorded over time during meiosis I in live wild-type and mutant embryos expressing mCherry:Histone2B and GFP:β-tubulin translational fusions to mark chromosomes and microtubules, respectively. (B) Left, the ImageJ polygon tool was used to measure the area occupied by chromosomes at each time point for the embryos shown in A. Examples of how the area was traced are shown in each image (A). Right, measurements beginning at ovulation and taken every 30 s, ending when chromosomes were extruded into a polar body. If chromosomes did not extrude into a polar body, the movie was ended after a failed attempt to extrude chromosomes. Averages for the indicated number of embryos are shown. Right, compaction ratios of the areas occupied at ovulation (orange lines) divided by the smallest area occupied during meiosis I (blue lines).
FIGURE 5:
FIGURE 5:
Assembly of monopolar oocyte meiotic spindles in klp-18 mutant requires both the katanin activity of MEI-1 and ASPM-1. (A) Representative spinning-disk confocal images were recorded over time during meiosis I in live mutant embryos (Supplemental Movies S6–S9 and S13–S18) expressing mCherry:Histone2B and GFP:β-tubulin translational fusions to mark chromosomes and microtubules, respectively, with the exception of klp-18(or447ts) oocytes, which expressed GFP:Histone2B only. The images shown are from ovulation and from the time during meiosis I at which the chromosomes occupied the smallest area. (B) Scatter plot showing the ratios of the areas occupied by chromosomes at ovulation over the smallest areas occupied during meiosis I. For mei-1(-) and klp-18(-), measurements were taken using RNAi (black dots) and ts mutations (red dots) to reduce gene function. Average areas for combined genotypes at ovulation (O), average smallest areas (S), average ratios (O/S), and number of embryos analyzed for each genotype (N) are shown below the graph. (C) Bar graph showing the average ratio of the areas occupied at ovulation over the smallest area occupied during meiosis I for selected genotypes. The p values from Student's test are indicated in black for observations made in the mei-1(ct46ct103) background, in red for tba-2(sb27);tbb-2(sb26) background, and in blue when comparing these two when klp-18 is knocked down. p < 0.05 indicates a statistically significant difference.
FIGURE 6:
FIGURE 6:
Microtubule-severing-defective mei-1(ct46ct103) and tba-2(sb27);tbb-2(sb26) mutant oocytes assemble bipolar oocyte meiotic spindles. Spinning-disk confocal images were recorded over time during meiosis I in live wild-type (Supplemental Movie S1) and mutant embryos (Supplemental Movies S19 and S20) expressing mCherry:Histone2B and GFP:β-tubulin translational fusions to mark chromosomes and microtubules, respectively. Indicated time points begin at ovulation. A white dashed line marks the edge of the plasma membrane. Scale bar as shown.
FIGURE 7:
FIGURE 7:
Mutants lacking either mei-1–mediated microtubule severing or ASPM-1 are bipolar, whereas mutants lacking both are apolar. (A) Spinning-disk confocal images were recorded over time during meiosis I in live wild-type (Supplemental Movie S1) and mutant embryos (Supplemental Movies S2, S3, and S19–S22) expressing mCherry:Histone2B and GFP:β-tubulin translational fusions to mark chromosomes and microtubules, respectively. Indicated time points begin at ovulation. A white dashed line marks the edge of the plasma membrane. Scale bar as shown. (B) For mei-1(-) and klp-18(-), measurements were taken using RNAi (black dots) and ts mutations (red dots) to reduce gene function. Average ratios for combined genotypes (O/S) and the number of embryos analyzed for each genotype (N) are shown below the graph. (C) Bar graph showing the average ratio of the areas occupied at ovulation over the smallest area occupied during meiosis I for selected genotypes. The p values from Student's test are indicated; p < 0.05 indicates a statistically significant difference.
FIGURE 8:
FIGURE 8:
Models for how MEI-1 contributes to pole focusing by severing microtubules, whereas ASPM-1 cross-links parallel microtubules and KLP-18 promotes bipolarity by cross-linking antiparallel microtubules. (A) MEI-1 may mediate spindle pole assembly by severing chromatin-nucleated microtubules. (B) KLP-18 may promote bipolarity by cross-linking antiparallel microtubules with the help of an unknown factor. ASPM-1 may focus spindle poles by cross-linking the minus ends of parallel microtubules through a dynein-dependent mechanism; consistent with this model, GFP:DHC-1 is nearly absent from meiotic spindles in mei-1(-) oocyte meiotic spindles (Supplemental Figure S3). The recruitment of ASPM-1 to oocyte meiotic spindle poles requires MEI-1; however, it is not known whether this recruitment involves a direct or indirect interaction, and hence this relationship is not depicted.

References

    1. Albertson DG. Formation of the first cleavage spindle in nematode embryos. Dev Biol. 1984;101:61–72. - PubMed
    1. Albertson DG, Thomson JN. Segregation of holocentric chromosomes at meiosis in the nematode, Caenorhabditis elegans. Chromosome Res. 1993;1:15–26. - PubMed
    1. Bishop JD, Han Z, Schumacher JM. The Caenorhabditis elegans Aurora B kinase AIR-2 phosphorylates and is required for the localization of a BimC kinesin to meiotic and mitotic spindles. Mol Biol Cell. 2005;16:742–756. - PMC - PubMed
    1. Bond J, et al. ASPM is a major determinant of cerebral cortical size. Nat Genet. 2002;32:316–320. - PubMed
    1. Brenner S. The genetics of Caenorhabditis elegans. Genetics. 1974;77:71–94. - PMC - PubMed

Publication types