

Imaging characteristics of pathologically proven thymic hyperplasia: identifying features that can differentiate true from lymphoid hyperplasia
- PMID: 24555583
- PMCID: PMC4020512
- DOI: 10.2214/AJR.13.11210
Imaging characteristics of pathologically proven thymic hyperplasia: identifying features that can differentiate true from lymphoid hyperplasia
Abstract
Objective: The purpose of this article is to investigate the imaging characteristics of pathologically proven thymic hyperplasia and to identify features that can differentiate true hyperplasia from lymphoid hyperplasia.
Materials and methods: Thirty-one patients (nine men and 22 women; age range, 20-68 years) with pathologically confirmed thymic hyperplasia (18 true and 13 lymphoid) who underwent preoperative CT (n=27), PET/CT (n=5), or MRI (n=6) were studied. The length and thickness of each thymic lobe and the transverse and anterior-posterior diameters and attenuation of the thymus were measured on CT. Thymic morphologic features and heterogeneity on CT and chemical shift on MRI were evaluated. Maximum standardized uptake values were measured on PET. Imaging features between true and lymphoid hyperplasia were compared.
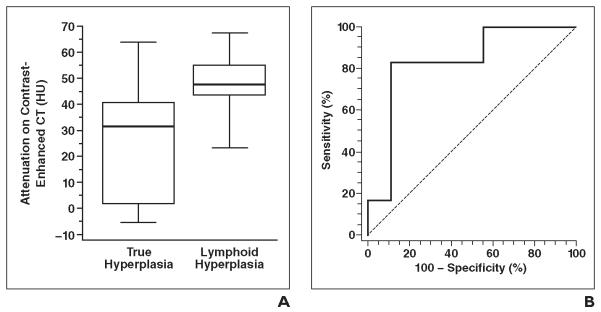
Results: No significant differences were observed between true and lymphoid hyperplasia in terms of thymic length, thickness, diameters, morphologic features, and other qualitative features (p>0.16). The length, thickness, and diameters of thymic hyperplasia were significantly larger than the mean values of normal glands in the corresponding age group (p<0.001). CT attenuation of lymphoid hyperplasia was significantly higher than that of true hyperplasia among 15 patients with contrast-enhanced CT (median, 47.9 vs 31.4 HU; Wilcoxon p=0.03). The receiver operating characteristic analysis yielded greater than 41.2 HU as the optimal threshold for differentiating lymphoid hyperplasia from true hyperplasia, with 83% sensitivity and 89% specificity. A decrease of signal intensity on opposed-phase images was present in all four cases with in- and opposed-phase imaging. The mean maximum standardized uptake value was 2.66.
Conclusion: CT attenuation of the thymus was significantly higher in lymphoid hyperplasia than in true hyperplasia, with an optimal threshold of greater than 41.2 HU in this cohort of patients with pathologically confirmed thymic hyperplasia.
Figures


Comment in
-
Usefulness of CT in differentiating lymphoid thymic hyperplasia from true thymic hyperplasia: added value of thymic measurements and CT attenuation.AJR Am J Roentgenol. 2015 Jan;204(1):W113-4. doi: 10.2214/AJR.14.13254. AJR Am J Roentgenol. 2015. PMID: 25539267 No abstract available.
-
Reply to "Usefulness of CT in differentiating lymphoid thymic hyperplasia from true thymic hyperplasia: added value of thymic measurements and CT attenuation".AJR Am J Roentgenol. 2015 Jan;204(1):W115. doi: 10.2214/AJR.14.13368. AJR Am J Roentgenol. 2015. PMID: 25539268 No abstract available.
References
-
- Shimosato Y, Mukai K. Tumors of the mediastinum: atlas of tumor pathology. 3rd series Vol. 21. Armed Forces Institute of Pathology; Washington, DC: 1997. pp. 158–168.
-
- Nishino M, Ashiku SK, Kocher ON, Thurer RL, Boiselle PM, Hatabu H. The thymus: a comprehensive review. RadioGraphics. 2006;26:335–348. - PubMed
-
- Nasseri F, Eftekhari F. Clinical and radiologic review of the normal and abnormal thymus: pearls and pitfalls. RadioGraphics. 2010;30:413–428. - PubMed
-
- Müller-Hermelink HK, Marx A. Thymoma. Curr Opin Oncol. 2000;12:426–433. - PubMed
Publication types
MeSH terms
Grants and funding
LinkOut - more resources
Full Text Sources
Other Literature Sources
Medical
