

Multimodality imaging to assess immediate response to irreversible electroporation in a rat liver tumor model
- PMID: 24555632
- PMCID: PMC4263650
- DOI: 10.1148/radiol.14130989
Multimodality imaging to assess immediate response to irreversible electroporation in a rat liver tumor model
Abstract
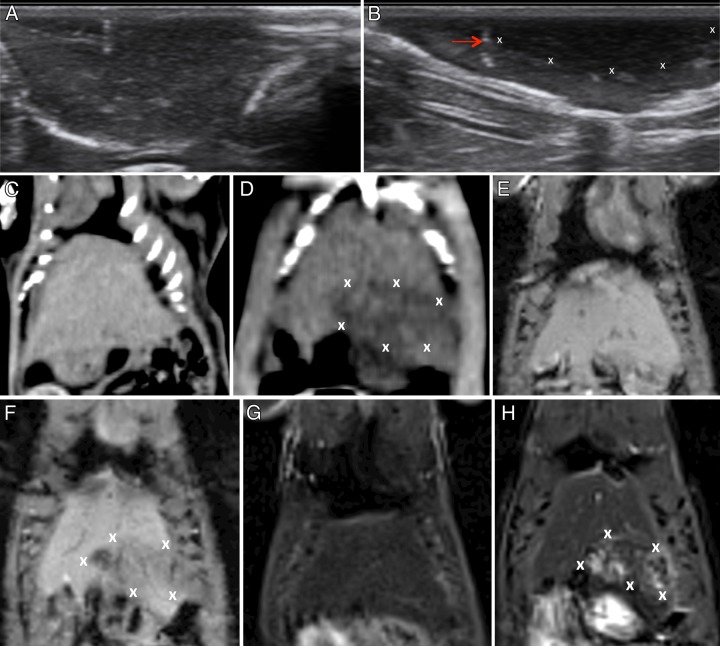
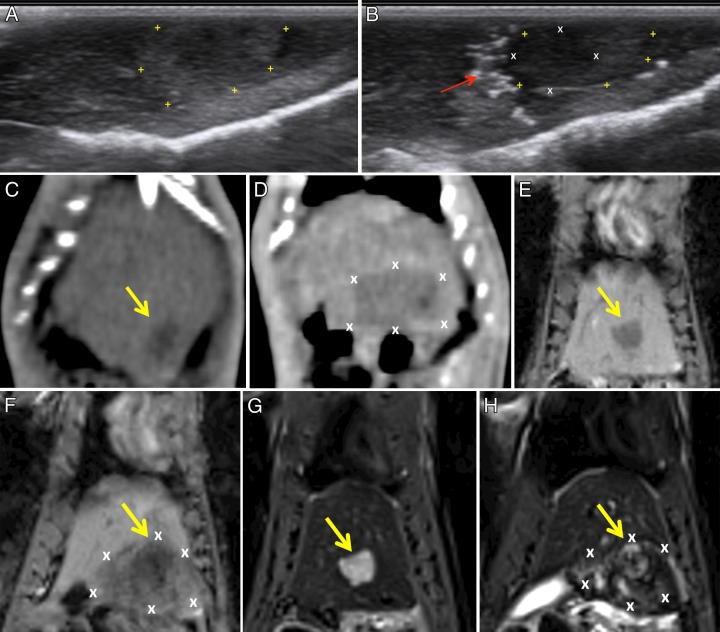
Purpose: To compare changes on ultrasonographic (US), computed tomographic (CT), and magnetic resonance (MR) images after irreversible electroporation (IRE) ablation of liver and tumor tissues in a rodent hepatoma model.
Materials and methods: Studies received approval from the institutional animal care and use committee. Forty-eight rats were used, and N1-S1 tumors were implanted in 24. Rats were divided into groups and allocated for studies with each modality. Imaging was performed in normal liver tissues and tumors before and after IRE. MR imaging was performed in one group before and after IRE after hepatic vessel ligation. US images were graded to determine echogenicity changes, CT attenuation was measured (in Hounsfield units), and MR imaging signal-to-noise ratio (SNR) was measured before and after IRE. Student t test was used to compare attenuation and SNR measurements before and after IRE (P < .05 indicated a significant difference).
Results: IRE ablation produced greater alterations to echogenicity in normal tissues than in tumors. Attenuation in ablated liver tissues was reduced compared with that in control tissues (P < .001), while small attenuation differences between ablated (42.11 HU ± 2.11) and control (45.14 HU ± 2.64) tumors trended toward significance (P = .052). SNR in ablated normal tissues was significantly altered after IRE (T1-weighted images: pre-IRE, 145.95 ± 24.32; post-IRE, 97.80 ± 18.03; P = .004; T2-weighted images, pre-IRE, 47.37 ± 18.31; post-IRE, 90.88 ± 37.15; P = .023). In tumors, SNR differences before and after IRE were not significant. No post-IRE signal changes were observed after hepatic vessel ligation.
Conclusion: IRE induces rapid changes on gray-scale US, unenhanced CT, and MR images. These changes are readily visible and may assist a performing physician to delineate ablation zones from the unablated surrounding parenchyma.
Figures
References
-
- Rubinsky B, Onik G, Mikus P. Irreversible electroporation: a new ablation modality—clinical implications. Technol Cancer Res Treat 2007;6(1):37–48. - PubMed
-
- Lee EW, Loh CT, Kee ST. Imaging guided percutaneous irreversible electroporation: ultrasound and immunohistological correlation. Technol Cancer Res Treat 2007;6(4):287–294. - PubMed
-
- Edd JF, Horowitz L, Davalos RV, Mir LM, Rubinsky B. In vivo results of a new focal tissue ablation technique: irreversible electroporation. IEEE Trans Biomed Eng 2006;53(7):1409–1415. - PubMed
-
- Ahmed M, Goldberg SN. Thermal ablation therapy for hepatocellular carcinoma. J Vasc Interv Radiol 2002;13(9 Pt 2):S231–S244. - PubMed
-
- Boaz TL, Lewin JS, Chung YC, Duerk JL, Clampitt ME, Haaga JR. MR monitoring of MR-guided radiofrequency thermal ablation of normal liver in an animal model. J Magn Reson Imaging 1998;8(1):64–69. - PubMed
Publication types
MeSH terms
Substances
Grants and funding
LinkOut - more resources
Full Text Sources
Other Literature Sources
