

Improvement of cellulose catabolism in Clostridium cellulolyticum by sporulation abolishment and carbon alleviation
- PMID: 24555718
- PMCID: PMC3936895
- DOI: 10.1186/1754-6834-7-25
Improvement of cellulose catabolism in Clostridium cellulolyticum by sporulation abolishment and carbon alleviation
Abstract
Background: Clostridium cellulolyticum can degrade lignocellulosic biomass, and ferment the soluble sugars to produce valuable chemicals such as lactate, acetate, ethanol and hydrogen. However, the cellulose utilization efficiency of C. cellulolyticum still remains very low, impeding its application in consolidated bioprocessing for biofuels production. In this study, two metabolic engineering strategies were exploited to improve cellulose utilization efficiency, including sporulation abolishment and carbon overload alleviation.
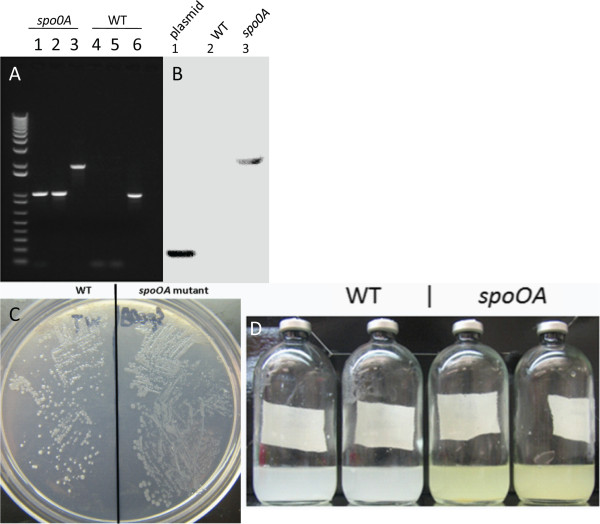
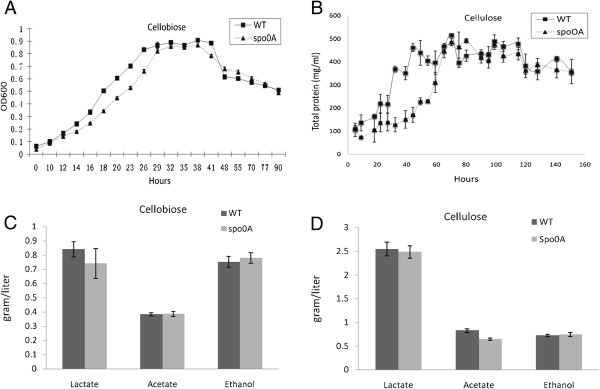
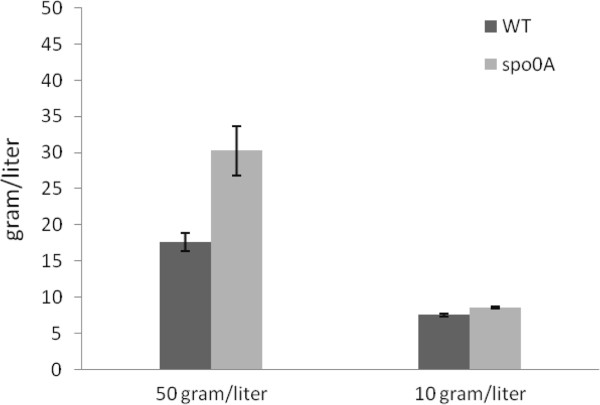
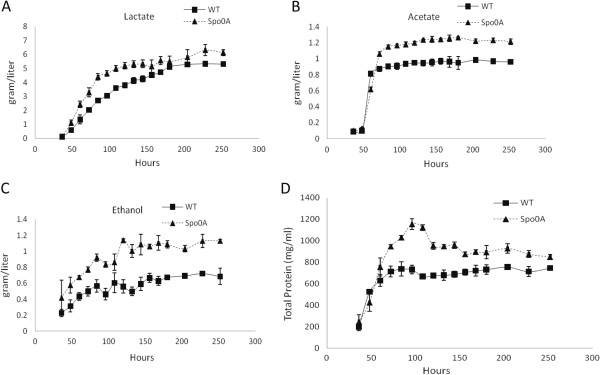
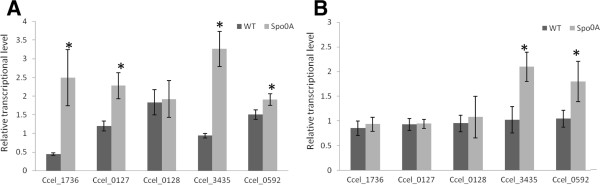
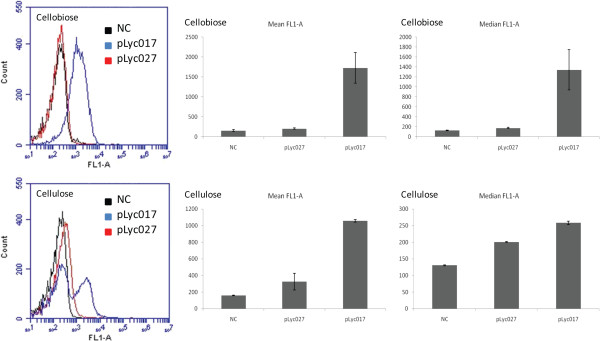
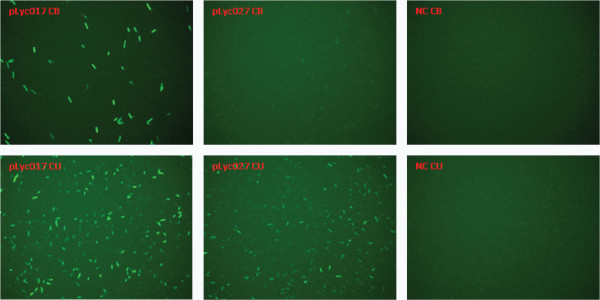
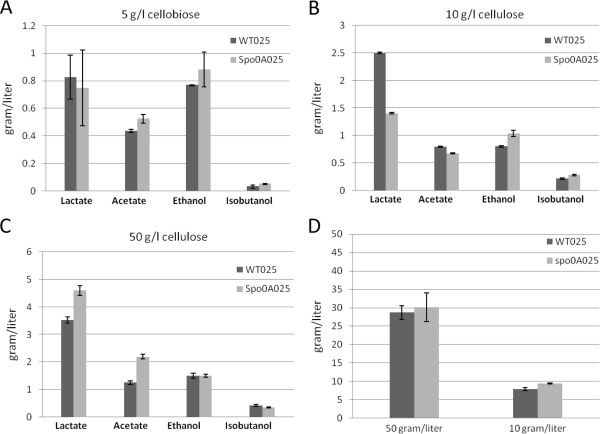
Results: The spo0A gene at locus Ccel_1894, which encodes a master sporulation regulator was inactivated. The spo0A mutant abolished the sporulation ability. In a high concentration of cellulose (50 g/l), the performance of the spo0A mutant increased dramatically in terms of maximum growth, final concentrations of three major metabolic products, and cellulose catabolism. The microarray and gas chromatography-mass spectrometry (GC-MS) analyses showed that the valine, leucine and isoleucine biosynthesis pathways were up-regulated in the spo0A mutant. Based on this information, a partial isobutanol producing pathway modified from valine biosynthesis was introduced into C. cellulolyticum strains to further increase cellulose consumption by alleviating excessive carbon load. The introduction of this synthetic pathway to the wild-type strain improved cellulose consumption from 17.6 g/l to 28.7 g/l with a production of 0.42 g/l isobutanol in the 50 g/l cellulose medium. However, the spo0A mutant strain did not appreciably benefit from introduction of this synthetic pathway and the cellulose utilization efficiency did not further increase. A technical highlight in this study was that an in vivo promoter strength evaluation protocol was developed using anaerobic fluorescent protein and flow cytometry for C. cellulolyticum.
Conclusions: In this study, we inactivated the spo0A gene and introduced a heterologous synthetic pathway to manipulate the stress response to heavy carbon load and accumulation of metabolic products. These findings provide new perspectives to enhance the ability of cellulolytic bacteria to produce biofuels and biocommodities with high efficiency and at low cost directly from lignocellulosic biomass.
Figures
Similar articles
-
Combined inactivation of the Clostridium cellulolyticum lactate and malate dehydrogenase genes substantially increases ethanol yield from cellulose and switchgrass fermentations.Biotechnol Biofuels. 2012 Jan 4;5(1):2. doi: 10.1186/1754-6834-5-2. Biotechnol Biofuels. 2012. PMID: 22214220 Free PMC article.
-
Metabolic engineering of Clostridium cellulolyticum for production of isobutanol from cellulose.Appl Environ Microbiol. 2011 Apr;77(8):2727-33. doi: 10.1128/AEM.02454-10. Epub 2011 Mar 4. Appl Environ Microbiol. 2011. PMID: 21378054 Free PMC article.
-
Carbon flux distribution and kinetics of cellulose fermentation in steady-state continuous cultures of Clostridium cellulolyticum on a chemically defined medium.J Bacteriol. 2001 Jan;183(1):119-30. doi: 10.1128/JB.183.1.119-130.2001. J Bacteriol. 2001. PMID: 11114908 Free PMC article.
-
Clostridium cellulolyticum: model organism of mesophilic cellulolytic clostridia.FEMS Microbiol Rev. 2005 Sep;29(4):741-64. doi: 10.1016/j.femsre.2004.11.003. Epub 2004 Dec 1. FEMS Microbiol Rev. 2005. PMID: 16102601 Review.
-
Unravelling carbon metabolism in anaerobic cellulolytic bacteria.Biotechnol Prog. 2006 Sep-Oct;22(5):1229-38. doi: 10.1021/bp060016e. Biotechnol Prog. 2006. PMID: 17022659 Review.
Cited by
-
MdFRK2-mediated sugar metabolism accelerates cellulose accumulation in apple and poplar.Biotechnol Biofuels. 2021 Jun 15;14(1):137. doi: 10.1186/s13068-021-01989-9. Biotechnol Biofuels. 2021. PMID: 34130710 Free PMC article.
-
Improved n-Butanol Production from Clostridium cellulovorans by Integrated Metabolic and Evolutionary Engineering.Appl Environ Microbiol. 2019 Mar 22;85(7):e02560-18. doi: 10.1128/AEM.02560-18. Print 2019 Apr 1. Appl Environ Microbiol. 2019. PMID: 30658972 Free PMC article.
-
Efficient Genome Editing in Clostridium cellulolyticum via CRISPR-Cas9 Nickase.Appl Environ Microbiol. 2015 Jul;81(13):4423-31. doi: 10.1128/AEM.00873-15. Epub 2015 Apr 24. Appl Environ Microbiol. 2015. PMID: 25911483 Free PMC article.
-
A fluorescent reporter system for anaerobic thermophiles.Front Bioeng Biotechnol. 2023 Jul 5;11:1226889. doi: 10.3389/fbioe.2023.1226889. eCollection 2023. Front Bioeng Biotechnol. 2023. PMID: 37476481 Free PMC article.
-
Secretomic analyses of Ruminiclostridium papyrosolvens reveal its enzymatic basis for lignocellulose degradation.Biotechnol Biofuels. 2019 Jul 15;12:183. doi: 10.1186/s13068-019-1522-8. eCollection 2019. Biotechnol Biofuels. 2019. PMID: 31338125 Free PMC article.
References
LinkOut - more resources
Full Text Sources
Other Literature Sources
Molecular Biology Databases
Miscellaneous
