

Regional variation in the allocation of development assistance for health
- PMID: 24555735
- PMCID: PMC3936884
- DOI: 10.1186/1744-8603-10-8
Regional variation in the allocation of development assistance for health
Abstract
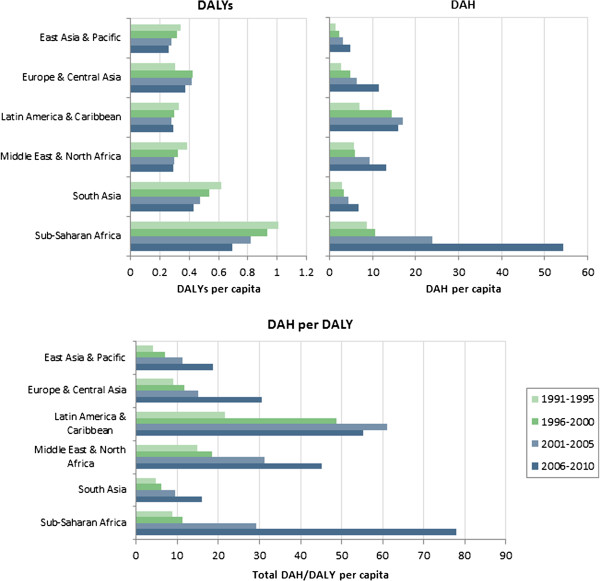
Background: The Global Burden of Disease (GBD) 2010 Study has published disability-adjusted life year (DALY) data at both regional and country levels from 1990 to 2010. Concurrently, the Institute for Health Metrics and Evaluation (IHME) has published estimates of development assistance for health (DAH) at the country-disease level for this same period of time.
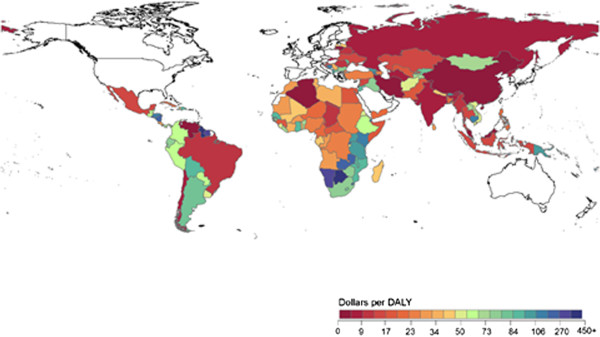
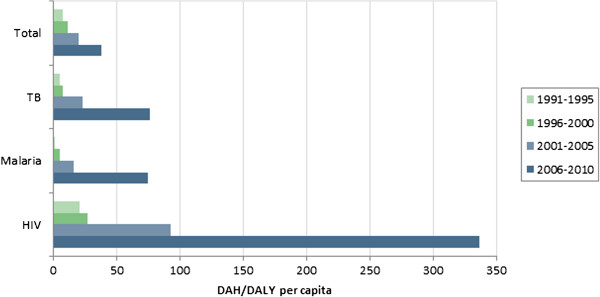
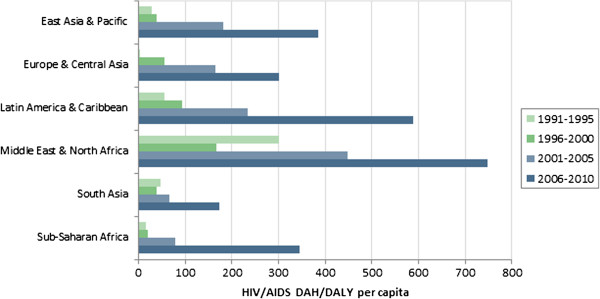
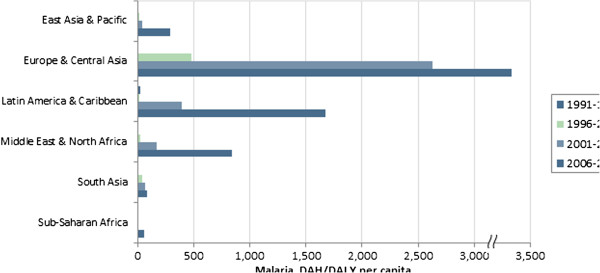
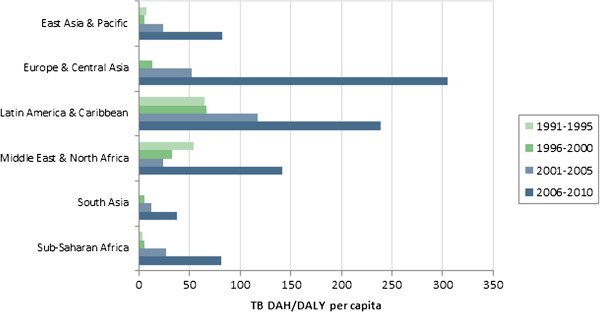
Findings: We use disease burden data from the GBD 2010 study and financing data from IHME to calculate ratios of DAH to DALYs across regions and diseases. We examine the magnitude of these ratios and how they have varied over time. We hypothesize that the variation in this ratio across regions would be relatively small. However, from 2006 to 2010, we find there was considerable variation in the levels of DAH per DALY across regions. For total funding, the relative standard deviation (standard deviation as a percentage of the mean) across regions was 50%. For DAH specific to HIV/AIDS, malaria and tuberculosis, the relative standard deviations were 50%, 200% and 60%, respectively. While these deviations are high, with the exception of malaria, they have decreased since the 1990s.
Conclusions: There are no evident explanations for so much variation in funding across regions, especially holding the purpose of the funding constant. This suggests donors' allocation processes have not been particularly sensitive to disease burdens. To maximize health gains, donors should explicitly incorporate new disease burden data along with the relative costs and efficacy of interventions into their allocation process.
Figures
References
-
- Institute for Health Metrics and Evaluation (IHME) Financing Global Health 2009: Tracking Development Assistance for Health. Seattle, WA: IHME; 2009.
-
- Institute for Health Metrics and Evaluation (IHME) Financing Global Health 2010: Development Assistance and Country Spending in Economic Uncertainty. Seattle, WA: IHME; 2010.
-
- Institute for Health Metrics and Evaluation (IHME) Financing Global Health 2011: Continued Growth as MDG Deadline Approaches. Seattle, WA: IHME; 2011.
-
- Institute for Health Metrics and Evaluation (IHME) Financing Global Health 2012: The End of the Golden Age? Seattle, WA: IHME; 2012.
MeSH terms
LinkOut - more resources
Full Text Sources
Other Literature Sources
Medical
