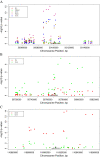
Methylation quantitative trait loci (meQTLs) are consistently detected across ancestry, developmental stage, and tissue type
- PMID: 24555763
- PMCID: PMC4028873
- DOI: 10.1186/1471-2164-15-145
Methylation quantitative trait loci (meQTLs) are consistently detected across ancestry, developmental stage, and tissue type
Abstract
Background: Individual genotypes at specific loci can result in different patterns of DNA methylation. These methylation quantitative trait loci (meQTLs) influence methylation across extended genomic regions and may underlie direct SNP associations or gene-environment interactions. We hypothesized that the detection of meQTLs varies with ancestral population, developmental stage, and tissue type. We explored this by analyzing seven datasets that varied by ancestry (African American vs. Caucasian), developmental stage (neonate vs. adult), and tissue type (blood vs. four regions of postmortem brain) with genome-wide DNA methylation and SNP data. We tested for meQTLs by constructing linear regression models of methylation levels at each CpG site on SNP genotypes within 50 kb under an additive model controlling for multiple tests.
Results: Most meQTLs mapped to intronic regions, although a limited number appeared to occur in synonymous or nonsynonymous coding SNPs. We saw significant overlap of meQTLs between ancestral groups, developmental stages, and tissue types, with the highest rates of overlap within the four brain regions. Compared with a random group of SNPs with comparable frequencies, meQTLs were more likely to be 1) represented among the most associated SNPs in the WTCCC bipolar disorder results and 2) located in microRNA binding sites.
Conclusions: These data give us insight into how SNPs impact gene regulation and support the notion that peripheral blood may be a reliable correlate of physiological processes in other tissues.
Figures


Similar articles
-
Characterization of cross-tissue genetic-epigenetic effects and their patterns in schizophrenia.Genome Med. 2018 Feb 26;10(1):13. doi: 10.1186/s13073-018-0519-4. Genome Med. 2018. PMID: 29482655 Free PMC article.
-
High density methylation QTL analysis in human blood via next-generation sequencing of the methylated genomic DNA fraction.Genome Biol. 2015 Dec 23;16:291. doi: 10.1186/s13059-015-0842-7. Genome Biol. 2015. PMID: 26699738 Free PMC article.
-
The presence of methylation quantitative trait loci indicates a direct genetic influence on the level of DNA methylation in adipose tissue.PLoS One. 2013;8(2):e55923. doi: 10.1371/journal.pone.0055923. Epub 2013 Feb 19. PLoS One. 2013. PMID: 23431366 Free PMC article.
-
Genetic impacts on DNA methylation: research findings and future perspectives.Genome Biol. 2021 Apr 30;22(1):127. doi: 10.1186/s13059-021-02347-6. Genome Biol. 2021. PMID: 33931130 Free PMC article. Review.
-
A large-scale integrative analysis of GWAS and common meQTLs across whole life course identifies genes, pathways and tissue/cell types for three major psychiatric disorders.Neurosci Biobehav Rev. 2018 Dec;95:347-352. doi: 10.1016/j.neubiorev.2018.10.005. Epub 2018 Oct 16. Neurosci Biobehav Rev. 2018. PMID: 30339835 Review.
Cited by
-
DNA methylation associated with postpartum depressive symptoms overlaps findings from a genome-wide association meta-analysis of depression.Clin Epigenetics. 2019 Nov 28;11(1):169. doi: 10.1186/s13148-019-0769-z. Clin Epigenetics. 2019. PMID: 31779682 Free PMC article.
-
DNA methylation profile of liver tissue in end-stage cholestatic liver disease.Epigenomics. 2022 Apr;14(8):481-497. doi: 10.2217/epi-2021-0343. Epub 2022 Apr 27. Epigenomics. 2022. PMID: 35473391 Free PMC article.
-
Integrated DNA methylation analysis reveals a potential role for ANKRD30B in Williams syndrome.Neuropsychopharmacology. 2020 Sep;45(10):1627-1636. doi: 10.1038/s41386-020-0675-2. Epub 2020 Apr 18. Neuropsychopharmacology. 2020. PMID: 32303053 Free PMC article.
-
Epigenetics and sarcoidosis.Eur Respir Rev. 2021 Jun 23;30(160):210076. doi: 10.1183/16000617.0076-2021. Print 2021 Jun 30. Eur Respir Rev. 2021. PMID: 34168064 Free PMC article. Review.
-
Common Genetic Variation Near Melatonin Receptor 1A Gene Linked to Job-Related Exhaustion in Shift Workers.Sleep. 2017 Jan 1;40(1):zsw011. doi: 10.1093/sleep/zsw011. Sleep. 2017. PMID: 28364478 Free PMC article.
References
-
- Davies MN, Volta M, Pidsley R, Lunnon K, Dixit A, Lovestone S, Coarfa C, Harris RA, Milosavljevic A, Troakes C. et al.Functional annotation of the human brain methylome identifies tissue-specific epigenetic variation across brain and blood. Genome Biol. 2012;13:R43. doi: 10.1186/gb-2012-13-6-r43. - DOI - PMC - PubMed
Publication types
MeSH terms
Grants and funding
LinkOut - more resources
Full Text Sources
Other Literature Sources

