. 2014 Jul 15;23(14):3641-56.
doi: 10.1093/hmg/ddu073. Epub 2014 Feb 19.

Contesting the dogma of an age-related heat shock response impairment: implications for cardiac-specific age-related disorders

Affiliations

Contesting the dogma of an age-related heat shock response impairment: implications for cardiac-specific age-related disorders

Alisia Carnemolla et al. Hum Mol Genet. .

Abstract

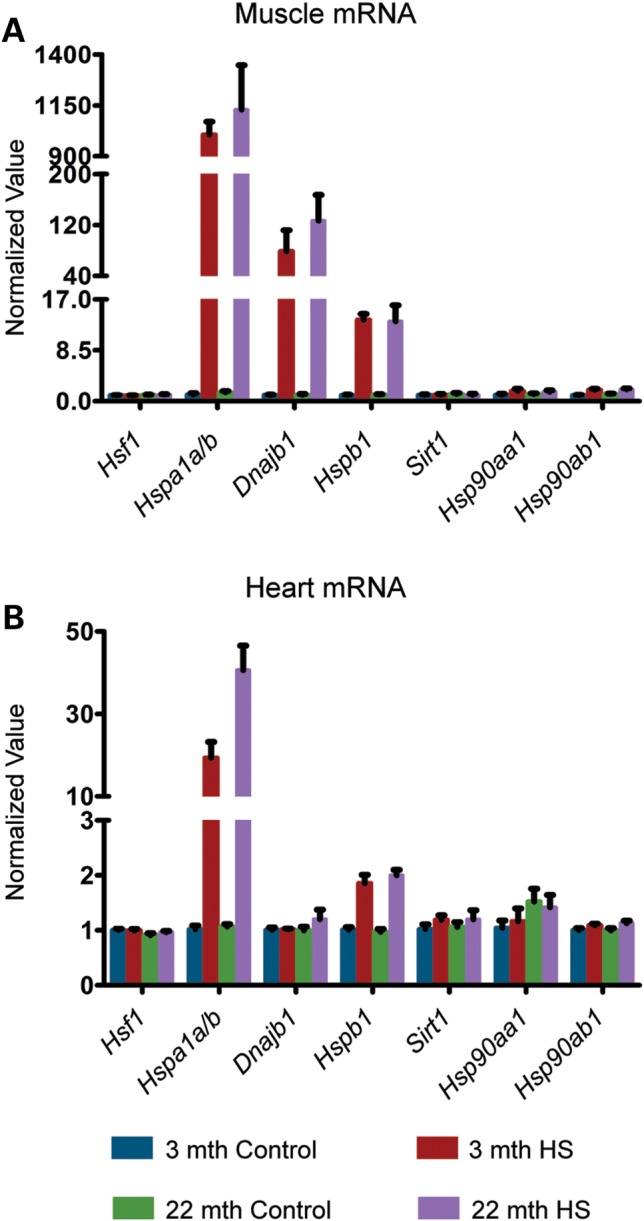
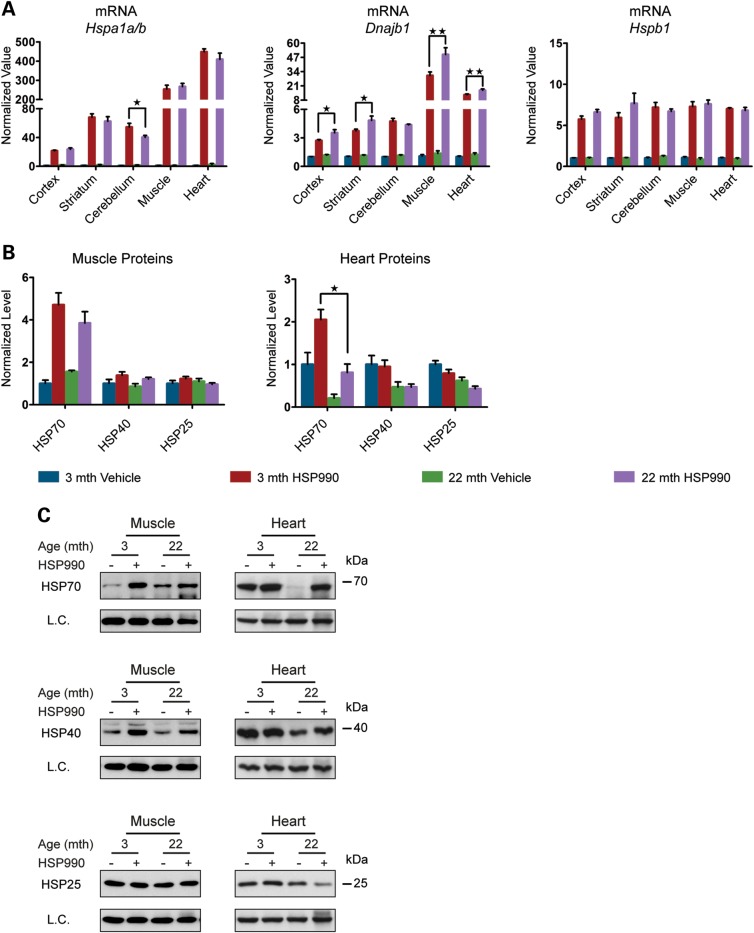
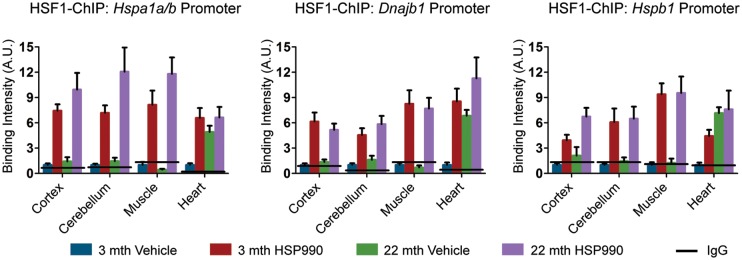
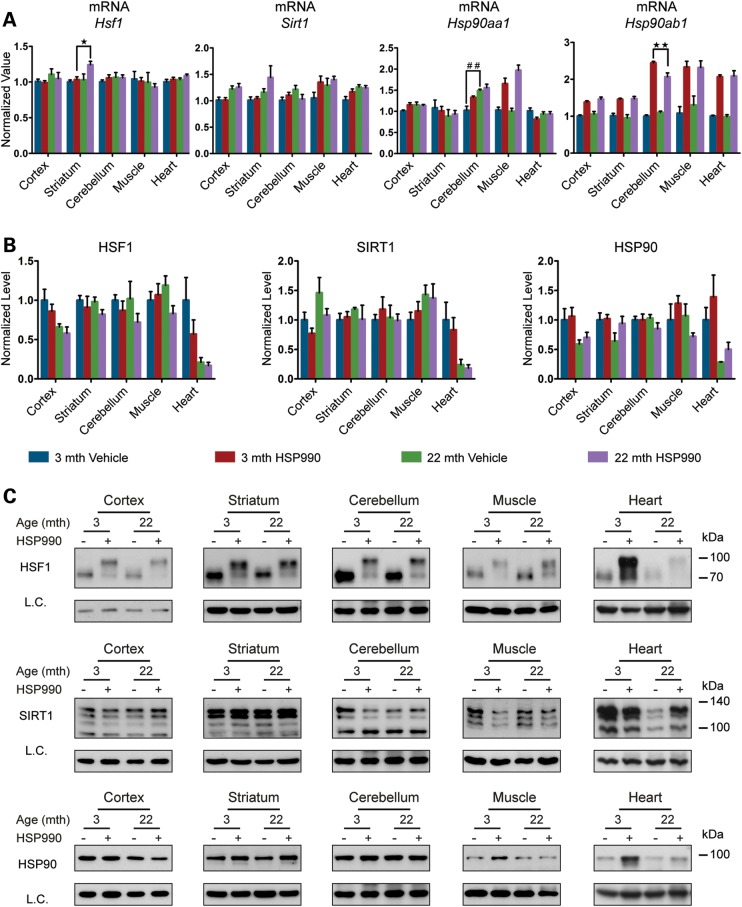
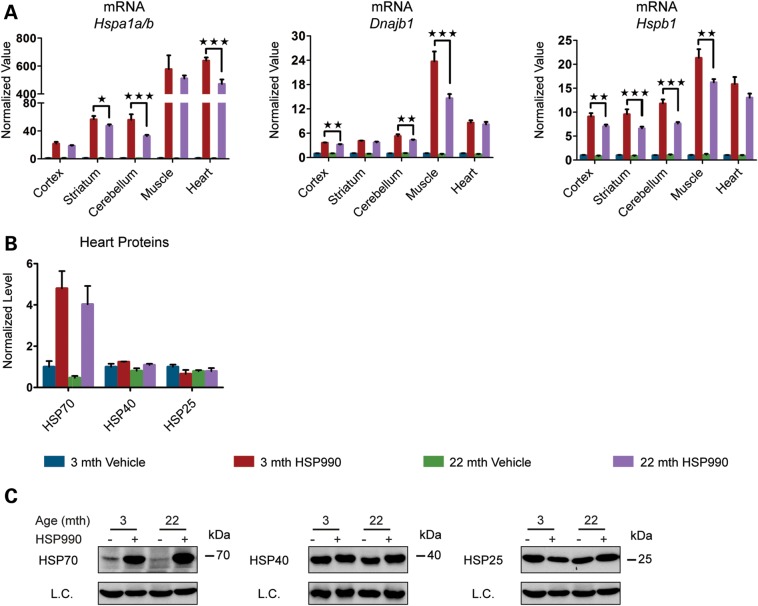
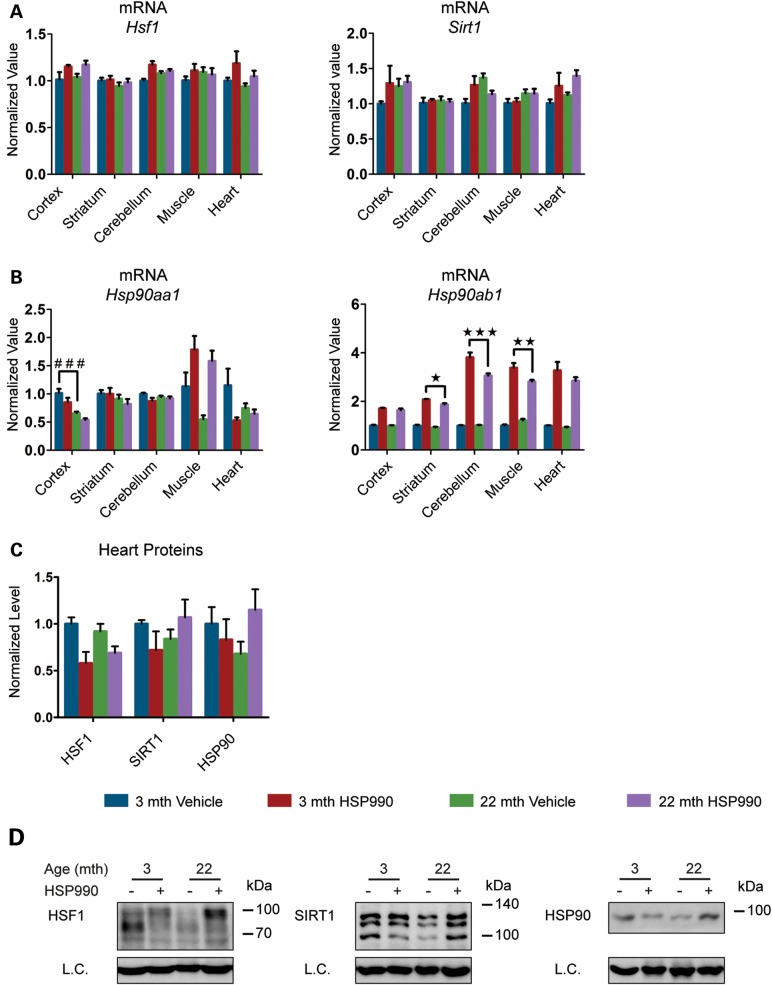
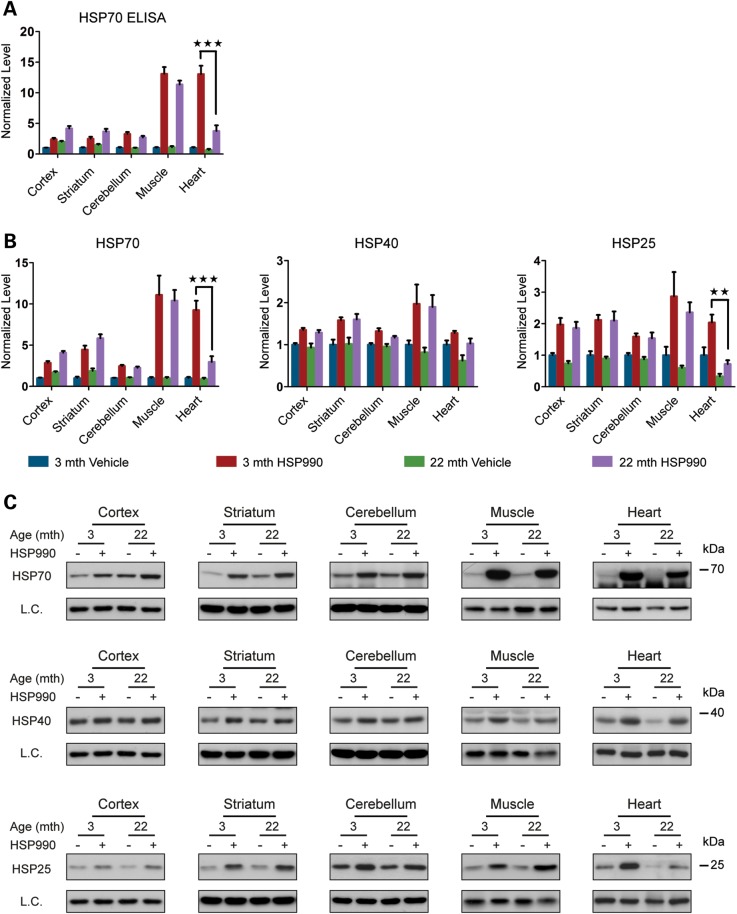
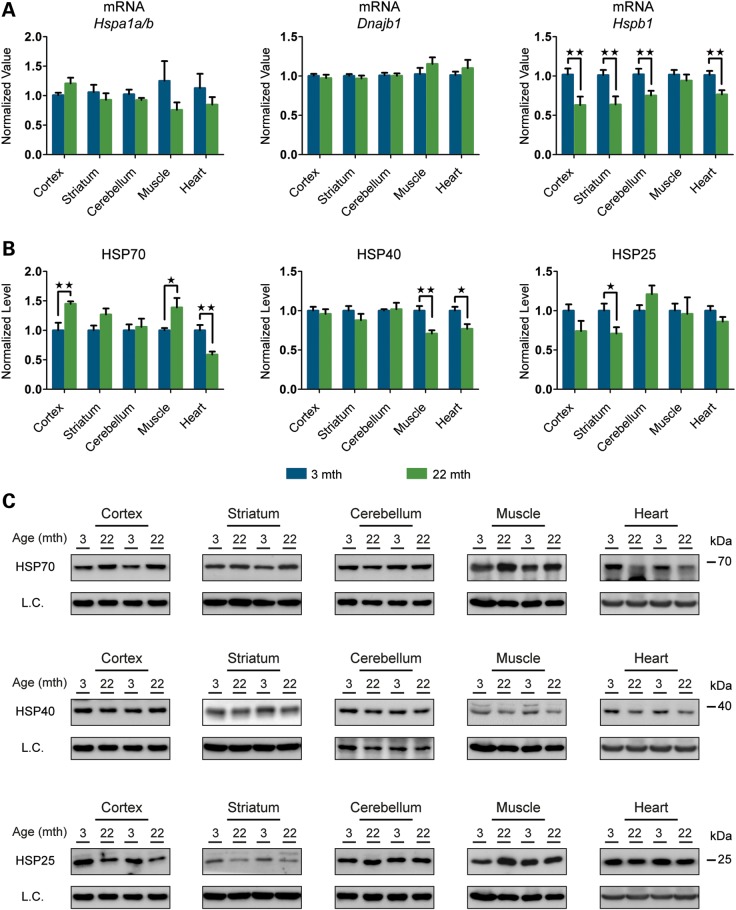
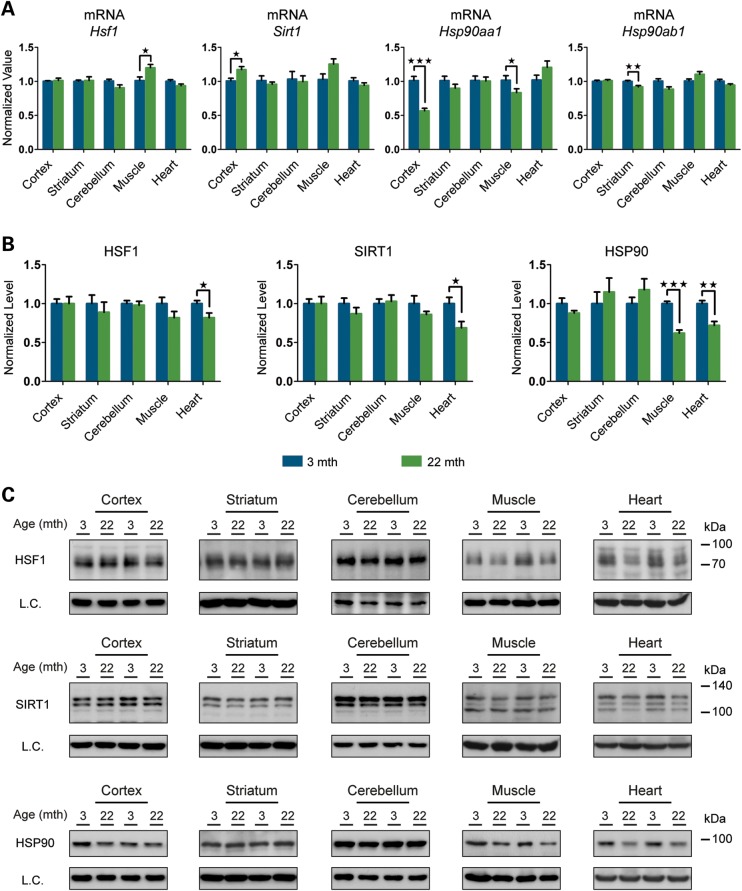
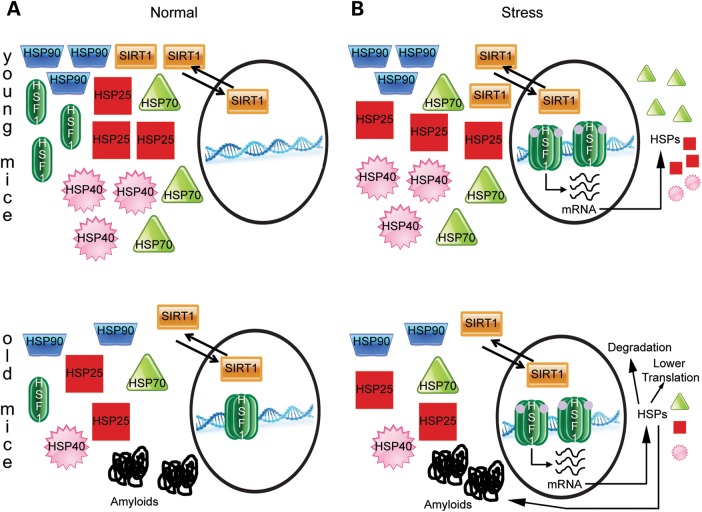
Ageing is associated with the reduced performance of physiological processes and has been proposed as a major risk factor for disease. An age-related decline in stress response pathways has been widely documented in lower organisms. In particular, the heat shock response (HSR) becomes severely compromised with age in Caenorhabditis elegans. However, a comprehensive analysis of the consequences of ageing on the HSR in higher organisms has not been documented. We used both HS and inhibition of HSP90 to induce the HSR in wild-type mice at 3 and 22 months of age to investigate the extent to which different brain regions, and peripheral tissues can sustain HSF1 activity and HS protein (HSP) expression with age. Using chromatin immunoprecipitation, quantitative reverse transcription polymerase chain reaction, western blotting and enzyme linked immunosorbent assay (ELISA), we were unable to detect a difference in the level or kinetics of HSP expression between young and old mice in all brain regions. In contrast, we did observe an age-related reduction in chaperone levels and HSR-related proteins in the heart. This could result in a decrease in the protein folding capacity of old hearts with implications for age-related cardiac disorders.


Figures

Figure 1.
Figure 1.
Effect of HS on HSP mRNA induction in young and old mice. Tissues were taken from 3- and 22-month-old mice 4 h after HS (15 min at 41.5°C). Controls were maintained at 36.9°C during this period. (A) qPCR analysis of the expression levels of Hsf1, Hspa1a/b, Dnajb1, Hspb1, Sirt1, Hsp90aa1 and Hsp90ab1 in the muscle. (B) qPCR analysis of the expression levels of Hsf1, Hspa1a/b, Dnajb1, Hspb1, Sirt1, Hsp90aa1 and Hsp90ab1 in the heart. Values were calculated relative to vehicle-treated young mice. Data are mean ± SEM. 4<n< 6/group. mth, months.
Figure 2.
Figure 2.
HSP induction is not impaired in old mice. Tissues were taken from 3- and 22-month-old mice 2 h after treatment with HSP990 (12 mg/kg) or vehicle. (A) qPCR analysis of the expression levels of Hspa1a/b, Dnajb1 and Hspb1 in brain regions and peripheral tissues. Values were calculated relative to vehicle-treated young mice. (B) The relative protein level of HSP70, HSP40 and HSP25 in the muscle and heart. Densitometric values were calculated relative to vehicle-treated young mice. (C) Representative western blots used for the quantification in (B). Data are the mean ± SEM. 4<n < 8/group. *P < 0.05; **P < 0.01: asterisk indicates the statistically significant difference in the level of induction; Muscle, quadriceps; L.C., loading control; mth, months.
Figure 3.
Figure 3.
HSF1 DNA-binding capacity is not negatively affected by ageing. Tissues were taken from 3- and 22-month-old mice 2 h after treatment with HSP990 (12 mg/kg) or vehicle. Levels of HSF1 bound to HS promoters as determined by ChIP. Solid line represents the IgG control values. Data are the mean ± SEM. 4<n < 8/group. Muscle, quadriceps; mth, months; A.U., arbitrary units.
Figure 4.
Figure 4.
Analysis of HSR regulatory proteins. Tissues were taken from 3- and 22-month-old mice 2 h after treatment with HSP990 (12 mg/kg) or vehicle. (A) qPCR analysis of the expression levels of Hsf1, Sirt1, Hsp90aa1 and Hsp90ab1 in brain regions and peripheral tissues. Values were calculated relative to vehicle-treated young mice. (B) Relative protein level of HSF1, SIRT1 and HSP90 in brain regions and peripheral tissues. Densitometric values were calculated relative to vehicle-treated young mice. (C) Representative western blots for HSF1, SIRT1 and HSP90. Data are the mean ± SEM. 4<n < 8/group. *P < 0.05; **P < 0.01. Asterisk indicates the statistically significant difference in the level of induction; ##P < 0.01: Number sign indicates the statistically significant difference between vehicle groups. Muscle, quadriceps; L.C., loading control; mth, months.
Figure 5.
Figure 5.
Analysis of the dynamics of HSP induction. Tissues were taken from 3- and 22-month-old mice 4 h after treatment with HSP990 (12 mg/kg) or vehicle. (A) qPCR analysis of the expression levels of Hspa1a/b, Dnajb1 and Hspb1 in brain regions and peripheral tissues. Values were calculated relative to vehicle-treated young mice. (B) Relative protein level of HSP70, HSP40 and HSP25 in the heart. Densitometric values were calculated relative to vehicle-treated young mice. (C) Representative western blots for HSP70, HSP40 and HSP25. Data are the mean ± SEM. 3 < n < 6/group. *P < 0.05; **P < 0.01; ***P < 0.001. Asterisk indicates the statistically significant difference in the level of induction. L.C., loading control; mth, months.
Figure 6.
Figure 6.
Analysis of the dynamics of HSR-regulatory proteins. Tissues were taken from 3- and 22-month-old mice 4 h after treatment with HSP990 (12 mg/kg) or vehicle. (A) qPCR analysis of the expression levels of Hsf1 and Sirt1 in brain regions and peripheral tissues. Values were calculated relative to vehicle-treated young mice. (B) qPCR analysis of the expression levels of Hsp90aa1 and Hsp90ab1 in brain regions and peripheral tissues. Values were calculated relative to vehicle-treated young mice. (C) Relative protein level of HSF1, SIRT1 and HSP90 in the heart. Densitometric values were calculated relative to vehicle-treated young mice. (D) Representative western blots for HSF1, SIRT1 and HSP90. Data are the mean ± SEM. 3 < n < 6/group. *P < 0.05; **P < 0.01; ***P < 0.001. Asterisk indicates the statistically significant difference in the level of induction. ###P < 0.001; number sign indicates the statistically significant difference between vehicle groups. L.C., loading control; mth, months.
Figure 7.
Figure 7.
HSP levels 20 h post-treatment with HSP990. Tissues were taken from 3- and 22-month-old mice 20 h after treatment with HSP990 (12 mg/kg) or vehicle. (A) ELISA of HSP70 levels in brain regions and peripheral tissues. Values were calculated relative to vehicle-treated young mice. (B) Relative protein level of HSP70, HSP40 and HSP25 in brain regions and peripheral tissues. Densitometric values were calculated relative to vehicle-treated young mice. (C) Representative western blots used for the quantification in (B). Data are the mean ± SEM. 5 < n < 6/group. **P < 0.01; ***P < 0.001. Asterisk indicates the statistically significant difference in the level of induction. Muscle, quadriceps; L.C., loading control; mth, months.
Figure 8.
Figure 8.
Basal expression levels of the major HSPs in young and old mice. (A) qPCR analysis of basal expression levels of Hspa1a/b, Hspb1 and Dnajb1 in brain regions and peripheral tissues from mice at 22 months of age when compared with 3 months (n = 8/age). (B) Relative basal levels of HSPs in brain regions and peripheral tissues of mice at 22 months of age when compared with 3 months (n = 7/age). (C) Representative western blots used for the quantification in (B). Data are the mean ± SEM. *P < 0.05; **P < 0.01. Asterisk indicates the statistically significant difference in the level of induction. Muscle, quadriceps; L.C., loading control; mth, months.
Figure 9.
Figure 9.
Basal expression levels of the major HSR regulators in young and old mice. (A) qPCR analysis of basal expression levels of Hsf1, Sirt1, Hsp90aa1 and Hsp90ab1 in brain regions and peripheral tissues from mice at 22 months of age when compared with 3 months (n = 8/age). (B) Relative basal protein levels of HS regulators in brain regions and peripheral tissues of mice at 22 months of age when compared with 3 months (n = 7/age). (C) Representative western blots used for the quantification in (B). Data are the mean ± SEM. *P < 0.05; **P < 0.01; ***P < 0.001. Asterisk indicates the statistically significant difference in the level of induction. Muscle, quadriceps; L.C., loading control; mth, months.
Figure 10.
Figure 10.
The proposed model for heart compensatory mechanism. (A) In normal, non-stressed conditions, HSR-related protein levels are reduced in old hearts and HSF1 is retained at the promoters of HSP genes. (B) Under stress conditions, HSF1 becomes hyperphosphorylated and actively promotes the transcription of HSP genes at a rate that is equivalent between young and old mice. Nevertheless, HSP accumulation is lower in old mice which could be a consequence of a slower rate of translation, an increased rate of degradation (perhaps due to a different tissue metabolism arising from compensatory remodelling of the heart) or sequestration of HSPs into amyloid deposits.

Similar articles

Cited by

References

    1. Kenyon C.J. The genetics of ageing. Nature. 2010;464:504–512. - PubMed
    1. Lopez-Otin C., Blasco M.A., Partridge L., Serrano M., Kroemer G. The hallmarks of aging. Cell. 2013;153:1194–1217. - PMC - PubMed
    1. Akerfelt M., Morimoto R.I., Sistonen L. Heat shock factors: integrators of cell stress, development and lifespan. Nat. Rev. Mol. Cell Biol. 2010;11:545–555. - PMC - PubMed
    1. Ron D., Walter P. Signal integration in the endoplasmic reticulum unfolded protein response. Nat. Rev. Mol. Cell Biol. 2007;8:519–529. - PubMed
    1. Haynes C.M., Ron D. The mitochondrial UPR - protecting organelle protein homeostasis. J. Cell Sci. 2010;123:3849–3855. - PubMed

Publication types

MeSH terms

Substances