. 2014 May;13(5):1184-97.
doi: 10.1074/mcp.M113.037374. Epub 2014 Feb 20.

An unbiased proteomic screen reveals caspase cleavage is positively and negatively regulated by substrate phosphorylation

Affiliations

An unbiased proteomic screen reveals caspase cleavage is positively and negatively regulated by substrate phosphorylation

Jacob P Turowec et al. Mol Cell Proteomics. 2014 May.

Abstract

Post-translational modifications of proteins regulate diverse cellular functions, with mounting evidence suggesting that hierarchical cross-talk between distinct modifications may fine-tune cellular responses. For example, in apoptosis, caspases promote cell death via cleavage of key structural and enzymatic proteins that in some instances is inhibited by phosphorylation near the scissile bond. In this study, we systematically investigated how protein phosphorylation affects susceptibility to caspase cleavage using an N-terminomic strategy, namely, a modified terminal amino isotopic labeling of substrates (TAILS) workflow, to identify proteins for which caspase-catalyzed cleavage is modulated by phosphatase treatment. We validated the effects of phosphorylation on three of the identified proteins and found that Yap1 and Golgin-160 exhibit decreased cleavage when phosphorylated, whereas cleavage of MST3 was promoted by phosphorylation. Furthermore, using synthetic peptides we systematically examined the influence of phosphoserine throughout the entirety of caspase-3, -7, and -8 recognition motifs and observed a general inhibitory effect of phosphorylation even at residues considered outside the classical consensus motif. Overall, our work demonstrates a role for phosphorylation in controlling caspase-mediated cleavage and shows that N-terminomic strategies can be tailored to study cross-talk between phosphorylation and proteolysis.


Figures
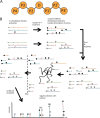
Fig. 1.
Fig. 1.
Workflow for the global, unbiased analysis of the integration of phosphorylation and caspase-mediated degradation. A, illustration of the cleavage site nomenclature for proteases. Caspases cleave the scissile bond between a P1 aspartic acid and the P1′ residue. B, HeLa cell lysates were treated with or without λ phosphatase and subjected to caspase treatment followed by dephosphorylation of the sample previously left phosphorylated. Primary amines on protein N termini and lysine residues were dimethylated using heavy (+34, open circles) or light (+28, black circles) formaldehyde. Samples were pooled and trypsinized, which exposed an amine on the N terminus of the internal tryptic peptide. These peptides are captured through reaction with an ∼80-kDa aldehyde-substituted polymer. Importantly, native protein N termini and neo-N termini generated by caspase cleavage are resistant to reaction with the polymer because their reactive amines have been blocked by dimethylation. Enrichment of the N-terminome then occurs via negative selection when the reacted polymer is filtered away using a 10-kDa cut-off spin column. LC-MS/MS analysis of isotopically dimethylated peptides then allows comparative analysis between caspase degradomes of phosphorylated and dephosphorylated lysates. Caspase substrates will be inferred through identification of those peptides with a P1 aspartic acid. In the event that there is no difference in caspase substrate proteolysis between phosphorylated and dephosphorylated samples, a peptide ratio of ∼1:1 will be observed in MS1 [1]. Of interest are those peptide pairs that deviate from a 1:1 ratio [2].
Fig. 2.
Fig. 2.
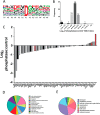
Summary of the peptides identified via TAILS. A, a WebLogo analysis (18) of the 57 peptides with P1 aspartic acid that were identified via TAILS. B, a log2 histogram of the quantified P1 Asp peptides was plotted to visualize the distribution of the effect of phosphorylation on caspase cleavage. The number of peptides in each group is indicated. C, a log2 mountain plot of the quantified P1 Asp peptides. MST3, Yap1, and Golgin-160 are highlighted in red. The peptides and their relative abundance are also presented in supplemental Table S1. D, E, Gene Ontology (GO) analysis was performed for all P1 Asp peptides (D) or those positively regulated by phosphorylation (i.e. substrates with more pronounced regulation than MST3; see red bar with log2 < 0 in C) (E) using PANTHER (45, 46).
Fig. 3.
Fig. 3.
TAILS analysis revealed MST3, Golgin-160, and Yap1 as validated candidates in which cleavage is regulated by phosphorylation. A, caspase recognition motif in MST3, Yap1, and Golgin-160. MS/MS analysis of MST3 (B), Yap1 (C), and Golgin-160 (D). E, HeLa lysates were treated identically to those samples prepared for N-terminomic analysis (as described in “Experimental Procedures”), except when they were utilized for Western blotting with antibodies directed against MST3, Yap1, or Golgin-160 as indicated. Caspase-3 and caspase-7 were used at concentrations of 0, 50, 500, and 5000 nm. The asterisk denotes a nonspecific band, and the arrow and arrowhead bands were differentially regulated by lysate dephosphorylation. F, HeLa cells were treated for 3 h with 1 μm staurosporine and/or 500 nm okadaic acid prior to lysis. Lysates were analyzed using immunoblots with the indicated antibodies. PARP1 cleavage was used as a control for caspase activation. The asterisk denotes a nonspecific band.
Fig. 4.
Fig. 4.
Caspase activities toward synthetic peptides modeled after substrates identified via TAILS. Synthetic peptides or phosphopeptides modeled after Yap1 (A), Golgin-160 (B), or MST3 (C) were treated with or without λ phosphatase as indicated prior to incubation with caspase-3 or caspase-7. Fluorescence of an internally quenched tryptophan residue at 355 nm after excitation at 280 nm was measured to assess caspase cleavage of peptide substrates. Error bars represent the standard deviation of four reactions. Means for the caspase activities with phosphorylated peptides and their unphosphorylated counterparts were compared using analysis of variance and Tukey's test. Control versus phosphatase-treated pairs for phosphopeptides all had p values < 0.0001.
Fig. 5.
Fig. 5.
Relative activities of caspase-3 and caspase-7 with model and phosphopeptides containing serine residues positioned within the P5–P4′ consensus motif for caspase cleavage. Caspase cleavage of peptide substrates was measured using fluorescence of an internally quenched tryptophan residue at 355 nm after excitation at 280 nm. Peptides or phosphopeptides modeled after Golgin-160 (A) and PARP1 (B) were assayed with caspase-3 or caspase-7 for 10 min at 37 °C and stopped by an excess of the irreversible caspase inhibitor zVAD-fmk. Error bars represent the standard deviation of four reactions. A, means of the caspase activities toward phosphorylated peptides and their nonphosphorylated counterparts were compared using analysis of variance and Tukey's test. For caspase-3, P4, P3, P1′, P2′, P3′, and P4′ phosphopeptide versus nonphosphorylated peptide pairs had p values < 0.0001, whereas all other pairs had a p value > 0.05. For caspase-7, P4, P3, P2′, P3′, and P4′ phosphopeptide versus nonphosphorylated peptide pairs had p values < 0.0001, whereas all other pairs had a p value > 0.05. B, cleavage of P4 peptides, in which serine or phosphoserine was substituted for aspartic acid, was not measurable at 200 nm of caspase-3 or 600 nm of caspase-7, so caspase concentrations were increased 5-fold (*). Error bars represent the standard deviation of four reactions. All pairs had p values < 0.0001, except for the P3 pair, which had a p value > 0.05.
Fig. 6.
Fig. 6.
Relative activity of caspase-8 with model peptides containing serine or phosphoserine at each position from P4 to P3′. Peptides modeled after the caspase-8 cleavage site of pro-caspase-3 were incubated with caspase-8 (100 nm) for 5 min at 37 °C before the reaction was terminated by an excess of the irreversible caspase inhibitor zVAD-fmk. Error bars represent the standard deviation of four reactions. Means of the caspase activities toward the phosphorylated and the corresponding nonphosphorylated peptide were compared using analysis of variance and Tukey's test. All pairs had p values < 0.001, except for the P3 and P3′ pair, which had p values > 0.05.

References

    1. Cohen G. M. (1997) Caspases: the executioners of apoptosis. Biochem. J. 326(Pt 1), 1–16 - PMC - PubMed
    1. Hanahan D., Weinberg R. A. (2000) The hallmarks of cancer. Cell 100, 57–70 - PubMed
    1. Hunter T. (2000) Signaling—2000 and beyond. Cell 100, 113–127 - PubMed
    1. Taylor R. C., Cullen S. P., Martin S. J. (2008) Apoptosis: controlled demolition at the cellular level. Nat. Rev. Mol. Cell. Biol. 9, 231–241 - PubMed
    1. Olsson M., Zhivotovsky B. (2011) Caspases and cancer. Cell Death Differ. 18, 1441–1449 - PMC - PubMed

Publication types