

The effects of increasing ocular surface stimulation on blinking and sensation
- PMID: 24557346
- PMCID: PMC3954158
- DOI: 10.1167/iovs.13-13780
The effects of increasing ocular surface stimulation on blinking and sensation
Abstract
Purpose: The purpose of this study was to determine how increasing ocular surface stimulation affected blinking and sensation, while controlling task concentration.
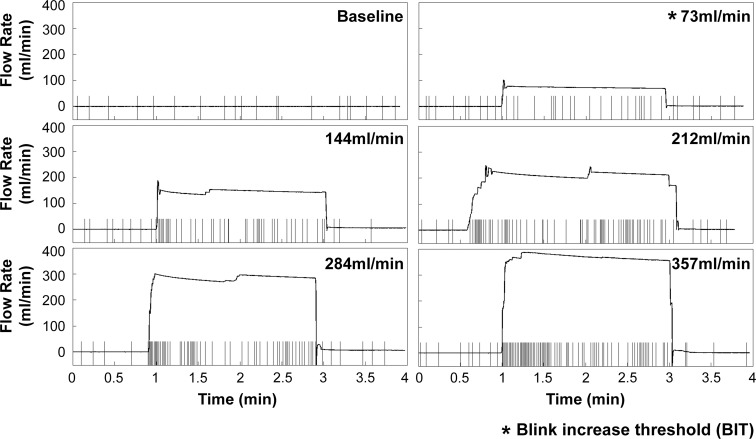
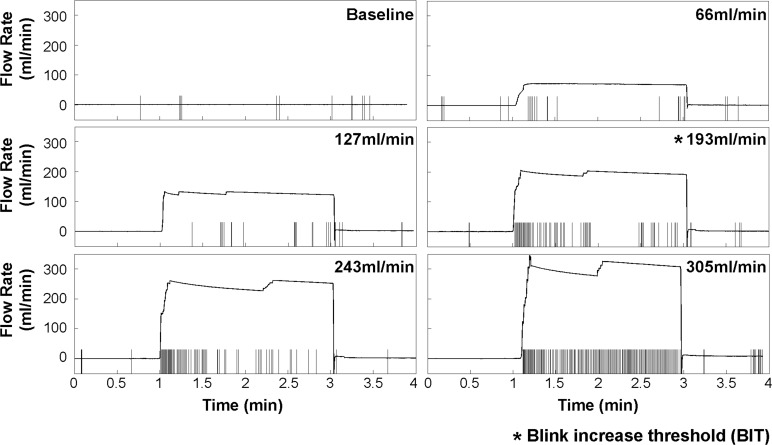
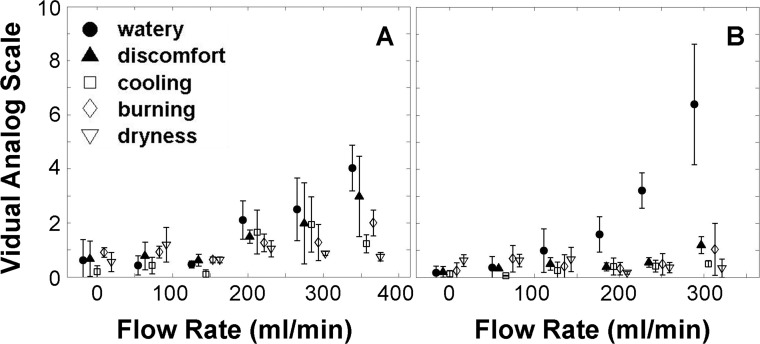
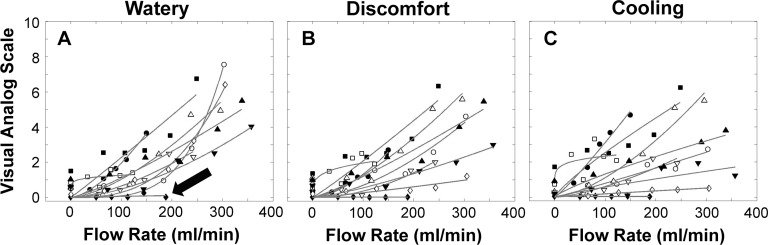
Methods: Ten healthy subjects concentrated on a task while a custom pneumatic device generated air flow toward the central cornea. Six flow rates (FRs) were randomly presented three times each and subjects used visual analog scales to record their sensory responses. The interblink interval (IBI) and the FR were recorded simultaneously and the IBI, sensory response, and corresponding FR were determined for each trial. The FR associated with a statistically significant decrease in IBI, the blink increase threshold (BIT), was calculated for each subject.
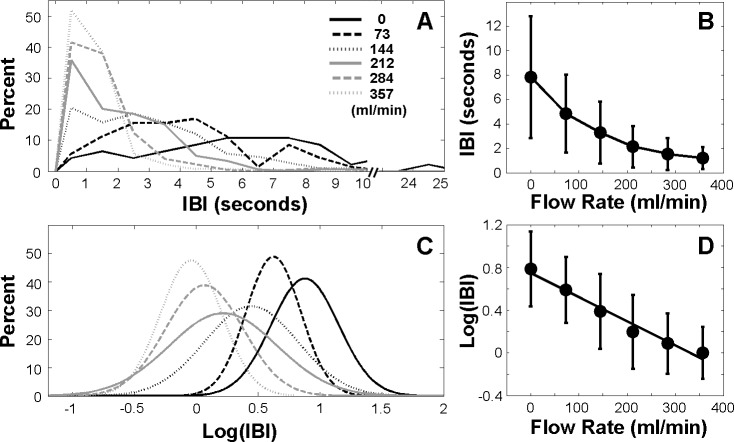
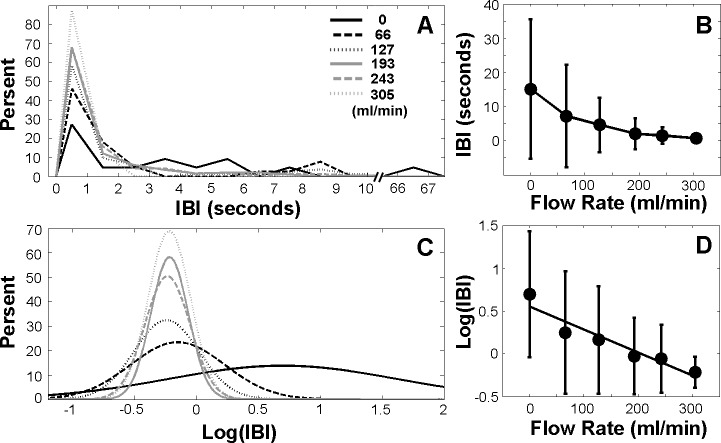
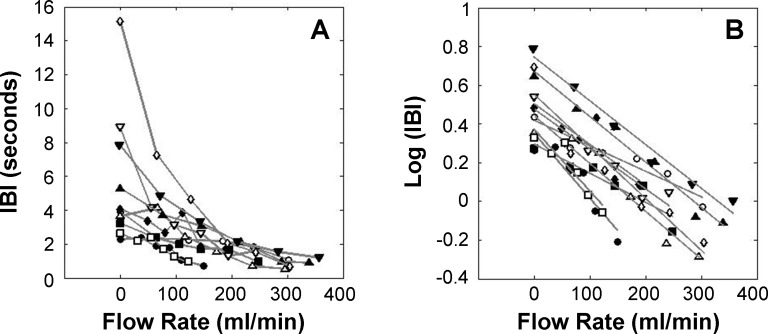
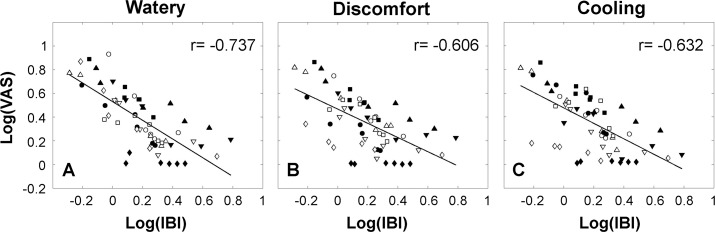
Results: Both the mean and SD of IBI were decreased with increasing stimulation, from 5.69 ± 3.96 seconds at baseline to 1.02 ± 0.37 seconds at maximum stimulation. The average BIT was 129 ± 20 mL/min flow rate with an IBI of 2.33 ± 1.10 seconds (permutation test, P < 0.001). After log transformation, there was a significant linear function between increasing FR and decreasing IBI within each subject (Pearson's r ≤ -0.859, P < 0.05). The IBI was highly correlated with wateriness, discomfort, and cooling ratings (Pearson's r ≤ -0.606, P < 0.001).
Conclusions: There was a dose-response-like relationship between increased surface stimulation and blinking in healthy subjects, presumably for protection of the ocular surface. The blink response was highly correlated with ocular surface sensation, which is not surprising given their common origins. The BIT, a novel metric, may provide an additional end point for studies on dry eye or other conditions.
Keywords: blinking; ocular surface stimulation; sensation.
Figures
Similar articles
-
The Effects of Increasing Ocular Surface Stimulation on Blinking and Tear Secretion.Invest Ophthalmol Vis Sci. 2015 Jul;56(8):4211-20. doi: 10.1167/iovs.14-16313. Invest Ophthalmol Vis Sci. 2015. PMID: 26132780 Free PMC article.
-
The effects of mild ocular surface stimulation and concentration on spontaneous blink parameters.Curr Eye Res. 2014 Jan;39(1):9-20. doi: 10.3109/02713683.2013.822896. Epub 2013 Sep 18. Curr Eye Res. 2014. PMID: 24047501 Free PMC article.
-
Effect of contact lens wear and a near task on tear film break-up.Optom Vis Sci. 2010 May;87(5):350-7. doi: 10.1097/OPX.0b013e3181d951df. Optom Vis Sci. 2010. PMID: 20351601
-
The Ocular Protection Index.Cornea. 2008 Jun;27(5):509-13. doi: 10.1097/ICO.0b013e31816583f6. Cornea. 2008. PMID: 18520496 Review.
-
Blink: Characteristics, Controls, and Relation to Dry Eyes.Curr Eye Res. 2018 Jan;43(1):52-66. doi: 10.1080/02713683.2017.1381270. Epub 2017 Oct 18. Curr Eye Res. 2018. PMID: 29043838 Review.
Cited by
-
Trigeminal pathways for hypertonic saline- and light-evoked corneal reflexes.Neuroscience. 2014 Sep 26;277:716-23. doi: 10.1016/j.neuroscience.2014.07.052. Epub 2014 Jul 31. Neuroscience. 2014. PMID: 25086311 Free PMC article.
-
Mechanisms, imaging and structure of tear film breakup.Ocul Surf. 2018 Jan;16(1):4-30. doi: 10.1016/j.jtos.2017.09.007. Epub 2017 Sep 20. Ocul Surf. 2018. PMID: 28935579 Free PMC article. Review.
-
Effects of Tear Film Instability on Sensory Responses to Corneal Cold, Mechanical, and Chemical Stimuli.Invest Ophthalmol Vis Sci. 2019 Jul 1;60(8):2935-2941. doi: 10.1167/iovs.19-27298. Invest Ophthalmol Vis Sci. 2019. PMID: 31284310 Free PMC article.
-
The clinical and experimental significance of blinking behavior.J Optom. 2020 Apr-Jun;13(2):74-80. doi: 10.1016/j.optom.2019.09.002. Epub 2020 Jan 25. J Optom. 2020. PMID: 31992536 Free PMC article. Review.
-
Automated Detection and Quantification of Circadian Eye Blinks Using a Contact Lens Sensor.Transl Vis Sci Technol. 2015 Jan 22;4(1):4. doi: 10.1167/tvst.4.1.4. eCollection 2015 Jan. Transl Vis Sci Technol. 2015. PMID: 25635236 Free PMC article.
References
-
- Schaumberg DA, Sullivan DA, Buring JE, Dana MR. Prevalence of dry eye syndrome among US women. Am J Ophthalmol. 2003; 136: 318–326 - PubMed
-
- McCarty CA, Bansal AK, Livingston PM, Stanislavsky YL, Taylor HR. The epidemiology of dry eye in Melbourne, Australia. Ophthalmology. 1998; 105: 1114–1119 - PubMed
-
- Uchino M, Nishiwaki Y, Michikawa T, et al. Prevalence and risk factors of dry eye disease in Japan: Koumi study. Ophthalmology. 2011; 118: 2361–2367 - PubMed
-
- The definition and classification of dry eye disease: report of the Definition and Classification Subcommittee of the International Dry Eye WorkShop ( 2007). Ocul Surf. 2007; 5: 75–92 - PubMed
Publication types
MeSH terms
Grants and funding
LinkOut - more resources
Full Text Sources
Other Literature Sources
