

Epithelial remodeling as basis for machine-based identification of keratoconus
- PMID: 24557351
- PMCID: PMC3954156
- DOI: 10.1167/iovs.13-12578
Epithelial remodeling as basis for machine-based identification of keratoconus
Abstract
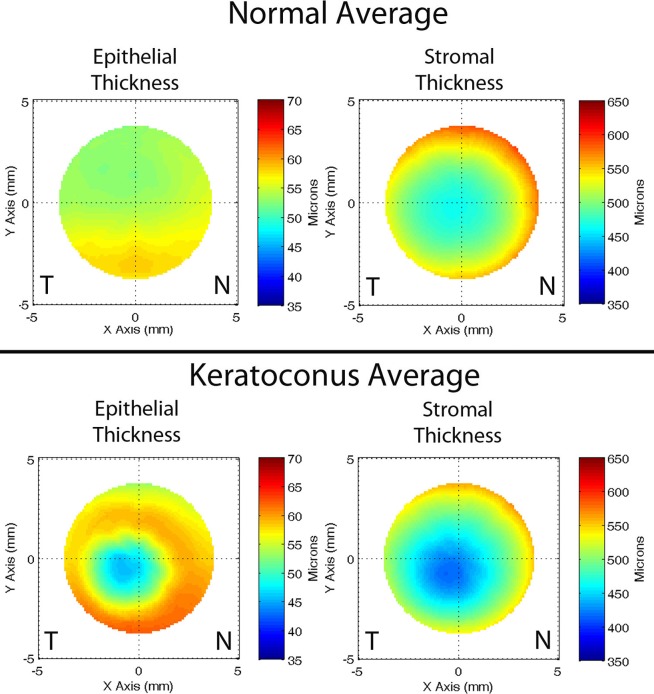
Purpose: To develop and evaluate automated computerized algorithms for differentiation of normal and keratoconus corneas based solely on epithelial and stromal thickness data.
Methods: Maps of the corneal epithelial and stromal thickness were generated from Artemis-1 very high-frequency ultrasound arc-scans of 130 normal and 74 keratoconic subjects diagnosed by combined topography and tomography examination. Keratoconus severity was graded based on anterior curvature, minimum corneal thickness, and refractive error. Computer analysis of maps produced 161 features for one randomly selected eye per subject. Stepwise linear discriminant analysis (LDA) and neural network (NN) analysis were then performed to develop multivariate models based on combinations of selected features to correctly classify cases. The sensitivity, specificity, and area under the receiver operating characteristic curve (AUC) were determined for each classifier.
Results: Stepwise LDA resulted in a six-variable model that provided an AUC of 100%, indicative of complete separation of keratoconic from normal corneas. Leave-one-out analysis resulted in 99.2% specificity and 94.6% sensitivity. Neural network analysis using the same six variables resulted in an AUC of 100% for the training set. Test set performance averaged over 10 trials gave a specificity of 99.5 ± 1.5% and sensitivity of 98.9 ± 1.9%. The LDA function values correlated with keratoconus severity grade.
Conclusions: The results demonstrate that epithelial remodeling in keratoconus represents an independent means for differentiation of normal from advanced keratoconus corneas.
Keywords: corneal epithelium; high‐frequency ultrasound; keratoconus; pachymetry.
Figures


References
-
- Ambrosio R, Wilson SE. Complications of laser in situ keratomileusis: etiology, prevention, and treatment. J Refract Surg. 2001; 17: 350–379 - PubMed
-
- Binder PS. Analysis of ectasia after laser in situ keratomileusis: risk factors. J Cataract Refract Surg. 2007; 33: 1530–1538 - PubMed
-
- Krachmer JH, Feder RF, Belin MW. Keratoconus and related non-inflammatory corneal thinning disorders. Surv Ophthalmol. 1984; 28: 293–322 - PubMed
-
- Wilson SE, Klyce SD. Screening for corneal topographic abnormalities before refractive surgery. Ophthalmology. 1994; 101: 145–152 - PubMed
-
- Klyce SD. Computer-assisted corneal topography. High-resolution graphic presentation and analysis of keratoscopy. Invest Ophthalmol Vis Sci. 1984; 25: 1426–1435 - PubMed
Publication types
MeSH terms
Grants and funding
LinkOut - more resources
Full Text Sources
Other Literature Sources
Medical
